From raw data to polished story — everything in one platform.
Every data source. One platform.
Stop wrangling connectors and start doing analysis. Golden connects to your data wherever it lives — from your laptop to your data warehouse — in seconds.
Always Live, Always Accurate
Your warehouse isn't a backup system — it's your single source of truth. Golden treats it that way.
Rather than copying data into a separate store, Golden pushes every query directly to your warehouse. That means every chart, every dashboard, and every report reflects exactly what's in Snowflake, BigQuery, or Redshift right now — with no sync delays, no data duplication, and no stale numbers.
Queries run in your warehouse, on your infrastructure. Golden just gives you the interface to ask the questions.
Drop in a file and start analyzing
Golden supports every file type, from the universal formats to modern columnar formats for large-scale file analysis to structured data from APIs or exports, smart header detection handles messy spreadsheets, and multi-sheet support means you pick exactly what you need.
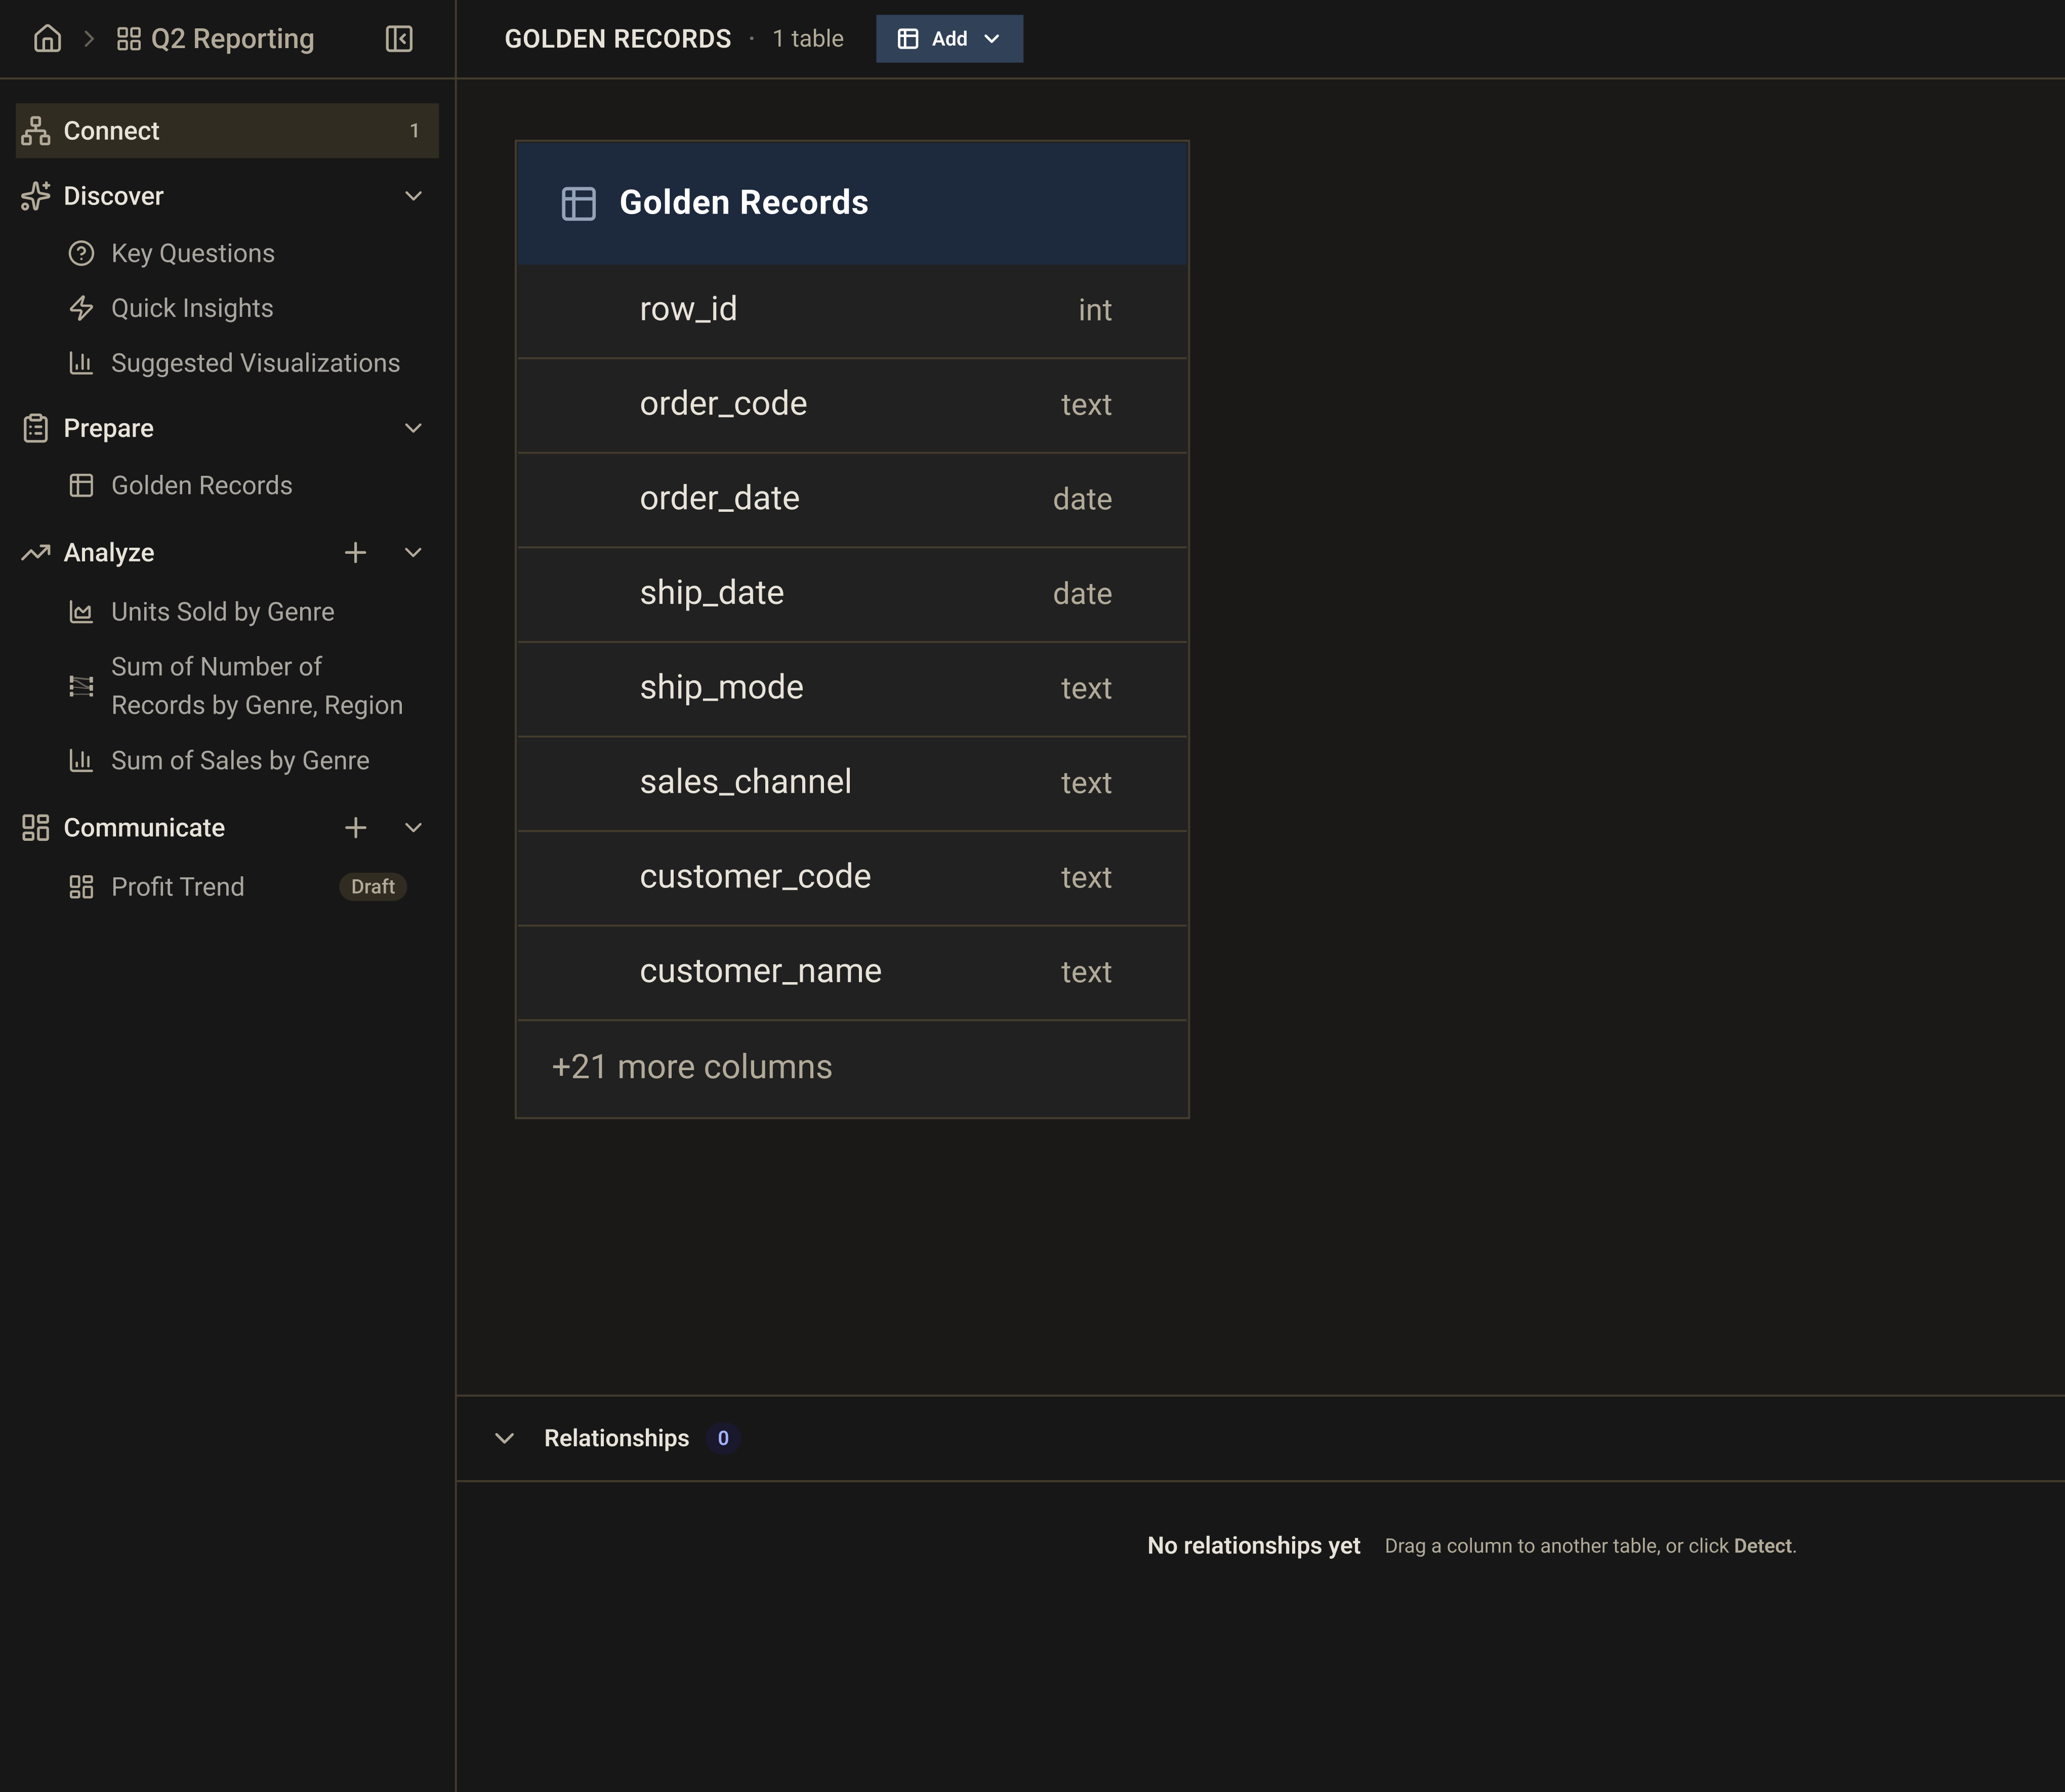
Multi-Table Schemas and Relationships
Real-world data lives across multiple tables. Golden understands that.
Most BI tools force you to pre-join everything into a flat file before you can analyze it. Golden lets you work with your data as it actually exists — multiple related tables, with relationships you define once and reuse everywhere. A visual entity relationship diagram shows you exactly how your tables connect, and you can query across all of them without writing a line of SQL.
- Visual entity relationship diagram
- Relationship editor — define joins across tables once, use everywhere
- Schema browser — explore your warehouse tables, columns, and types at a glance
- Visual query builder — no-code cross-table queries
- Native SQL editor — for when you need full control
Understand your data in seconds, not days.
Most analysts spend hours before they even know what questions to ask. Golden skips that step — the moment you load a dataset, it tells you what's interesting about it.
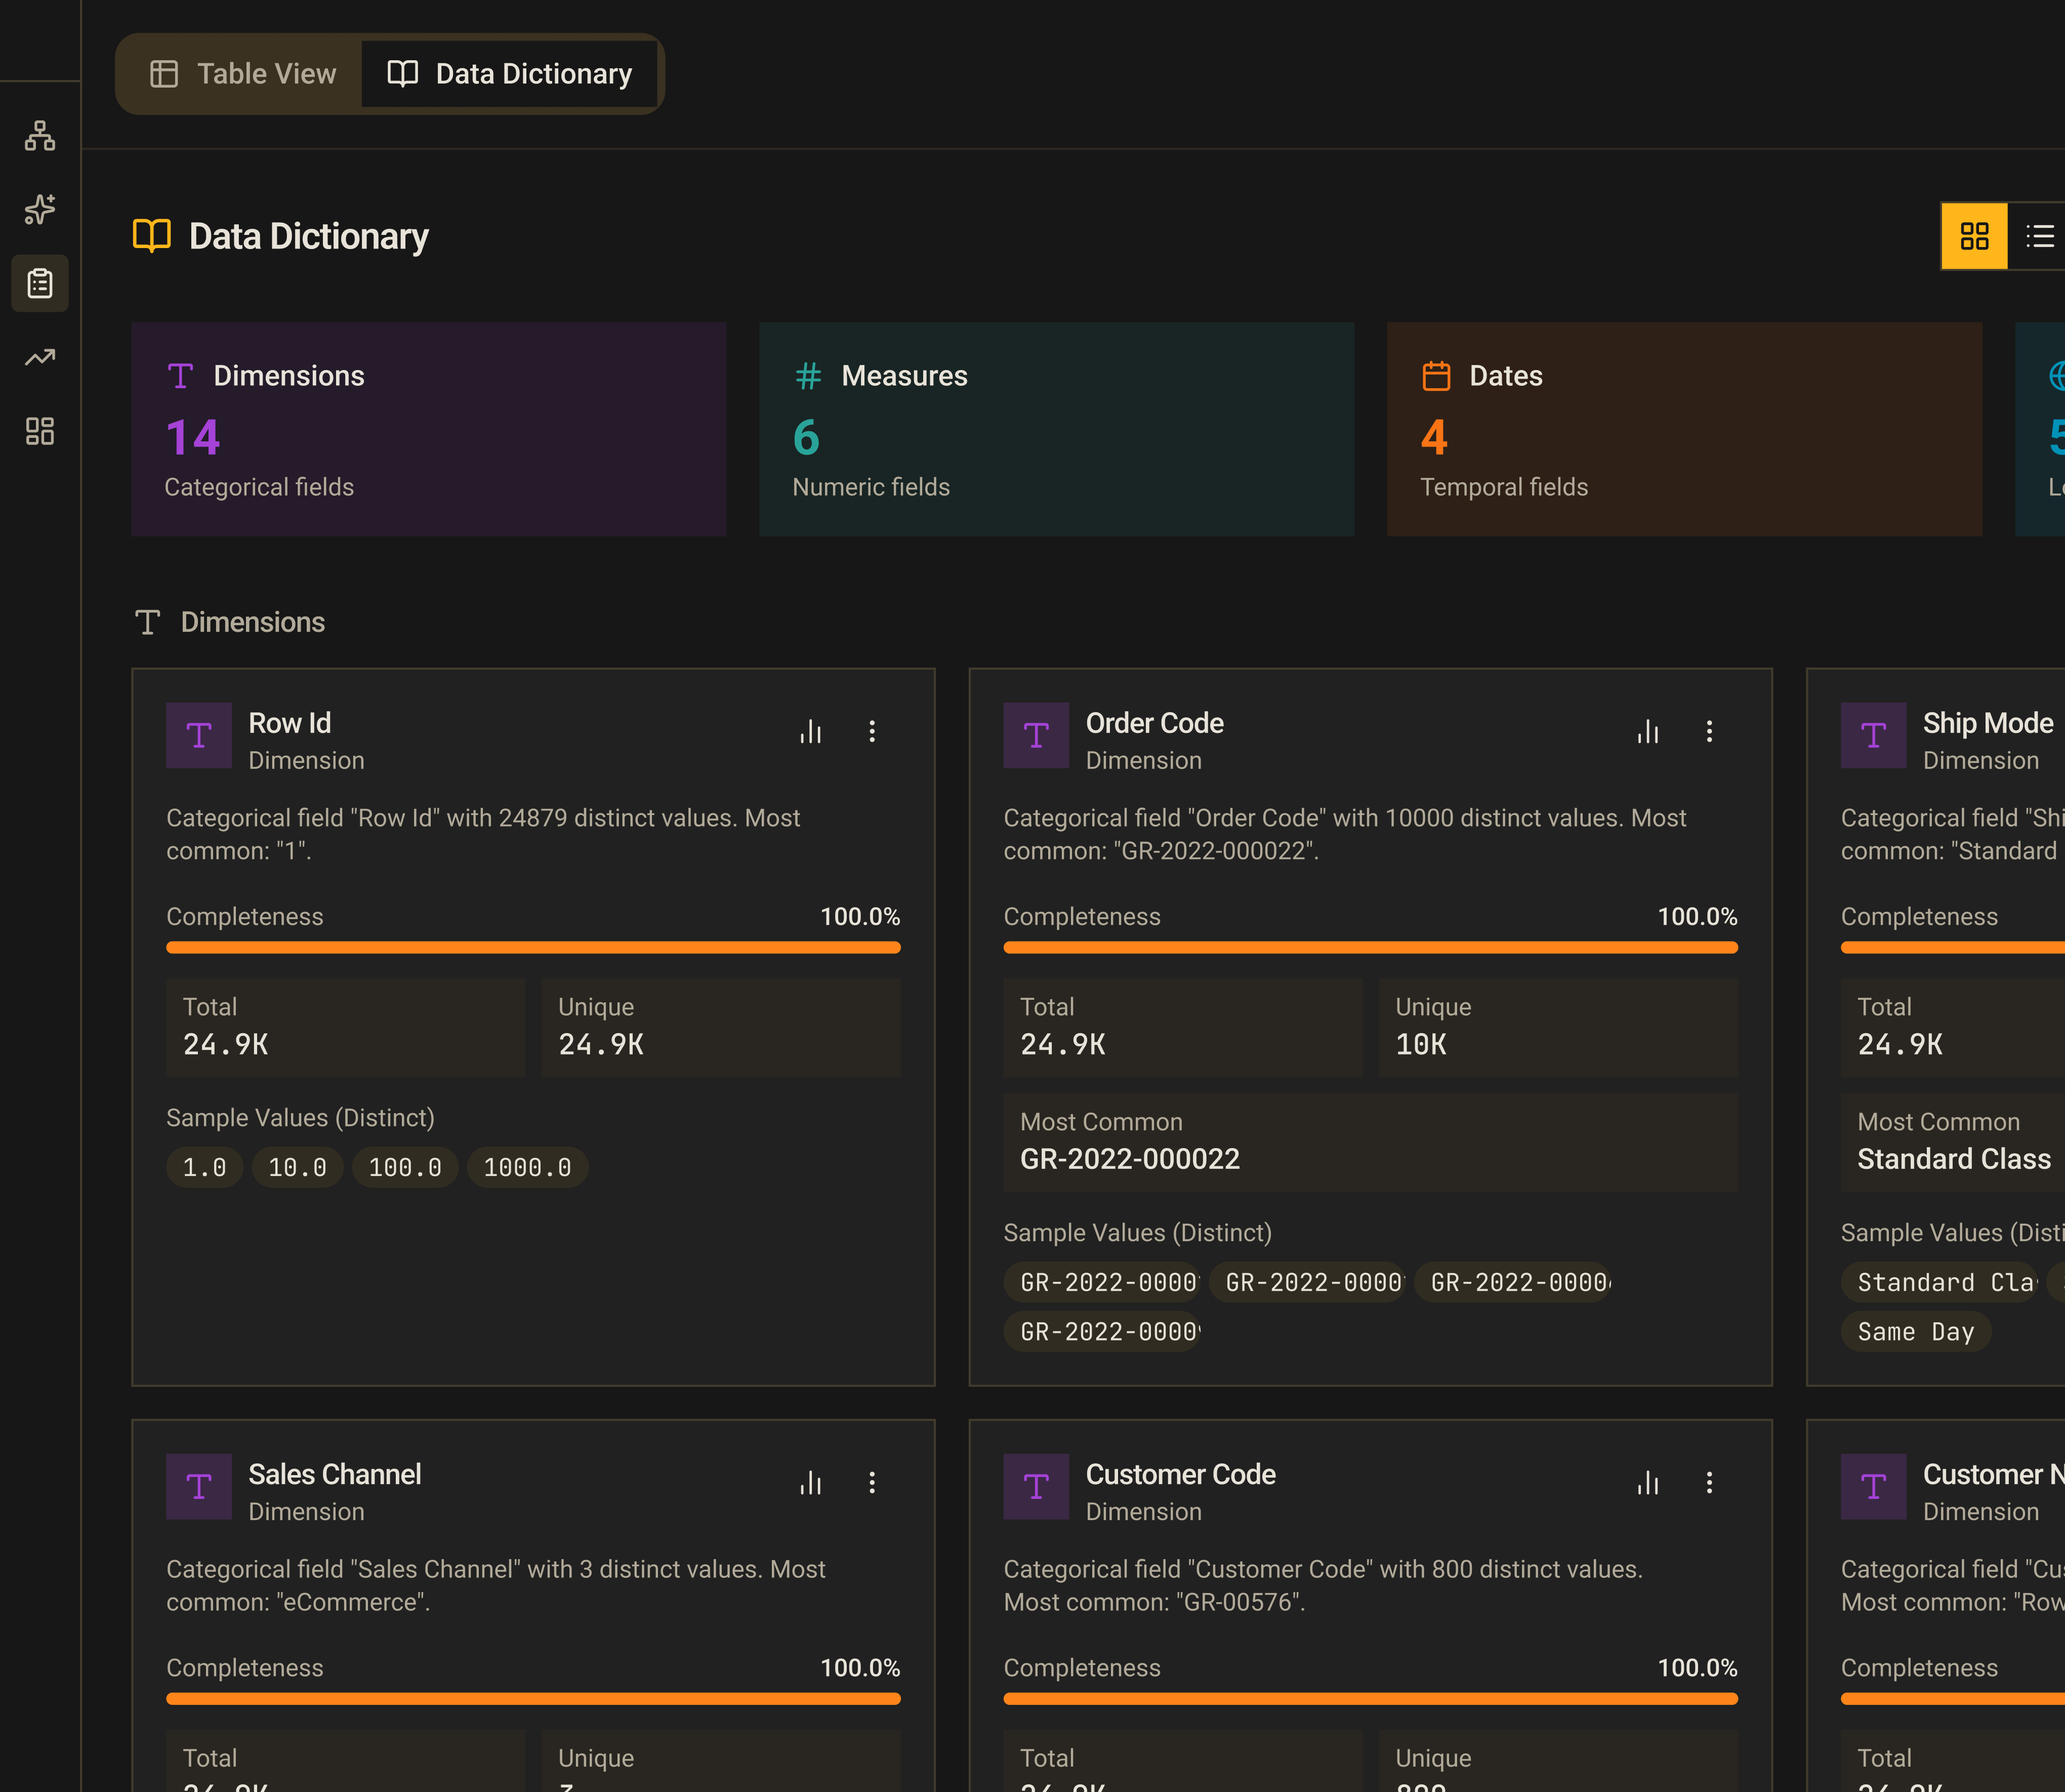
Know What You're Working With Before You Start
The worst time to discover a data quality problem is after you’ve built a dashboard and shared it with your team. Golden surfaces issues immediately — missing values, duplicate rows, inconsistent formats, outliers — so you can fix them before they become someone else’s problem.
- Instant data profile — row counts, nulls, uniqueness, and value distributions for every column, generated the moment your data loads
- Data quality scoring — an overall quality grade with specific flags, so you know exactly what needs attention
- Field profiles — per-column breakdowns showing min, max, mean, top values, and cardinality
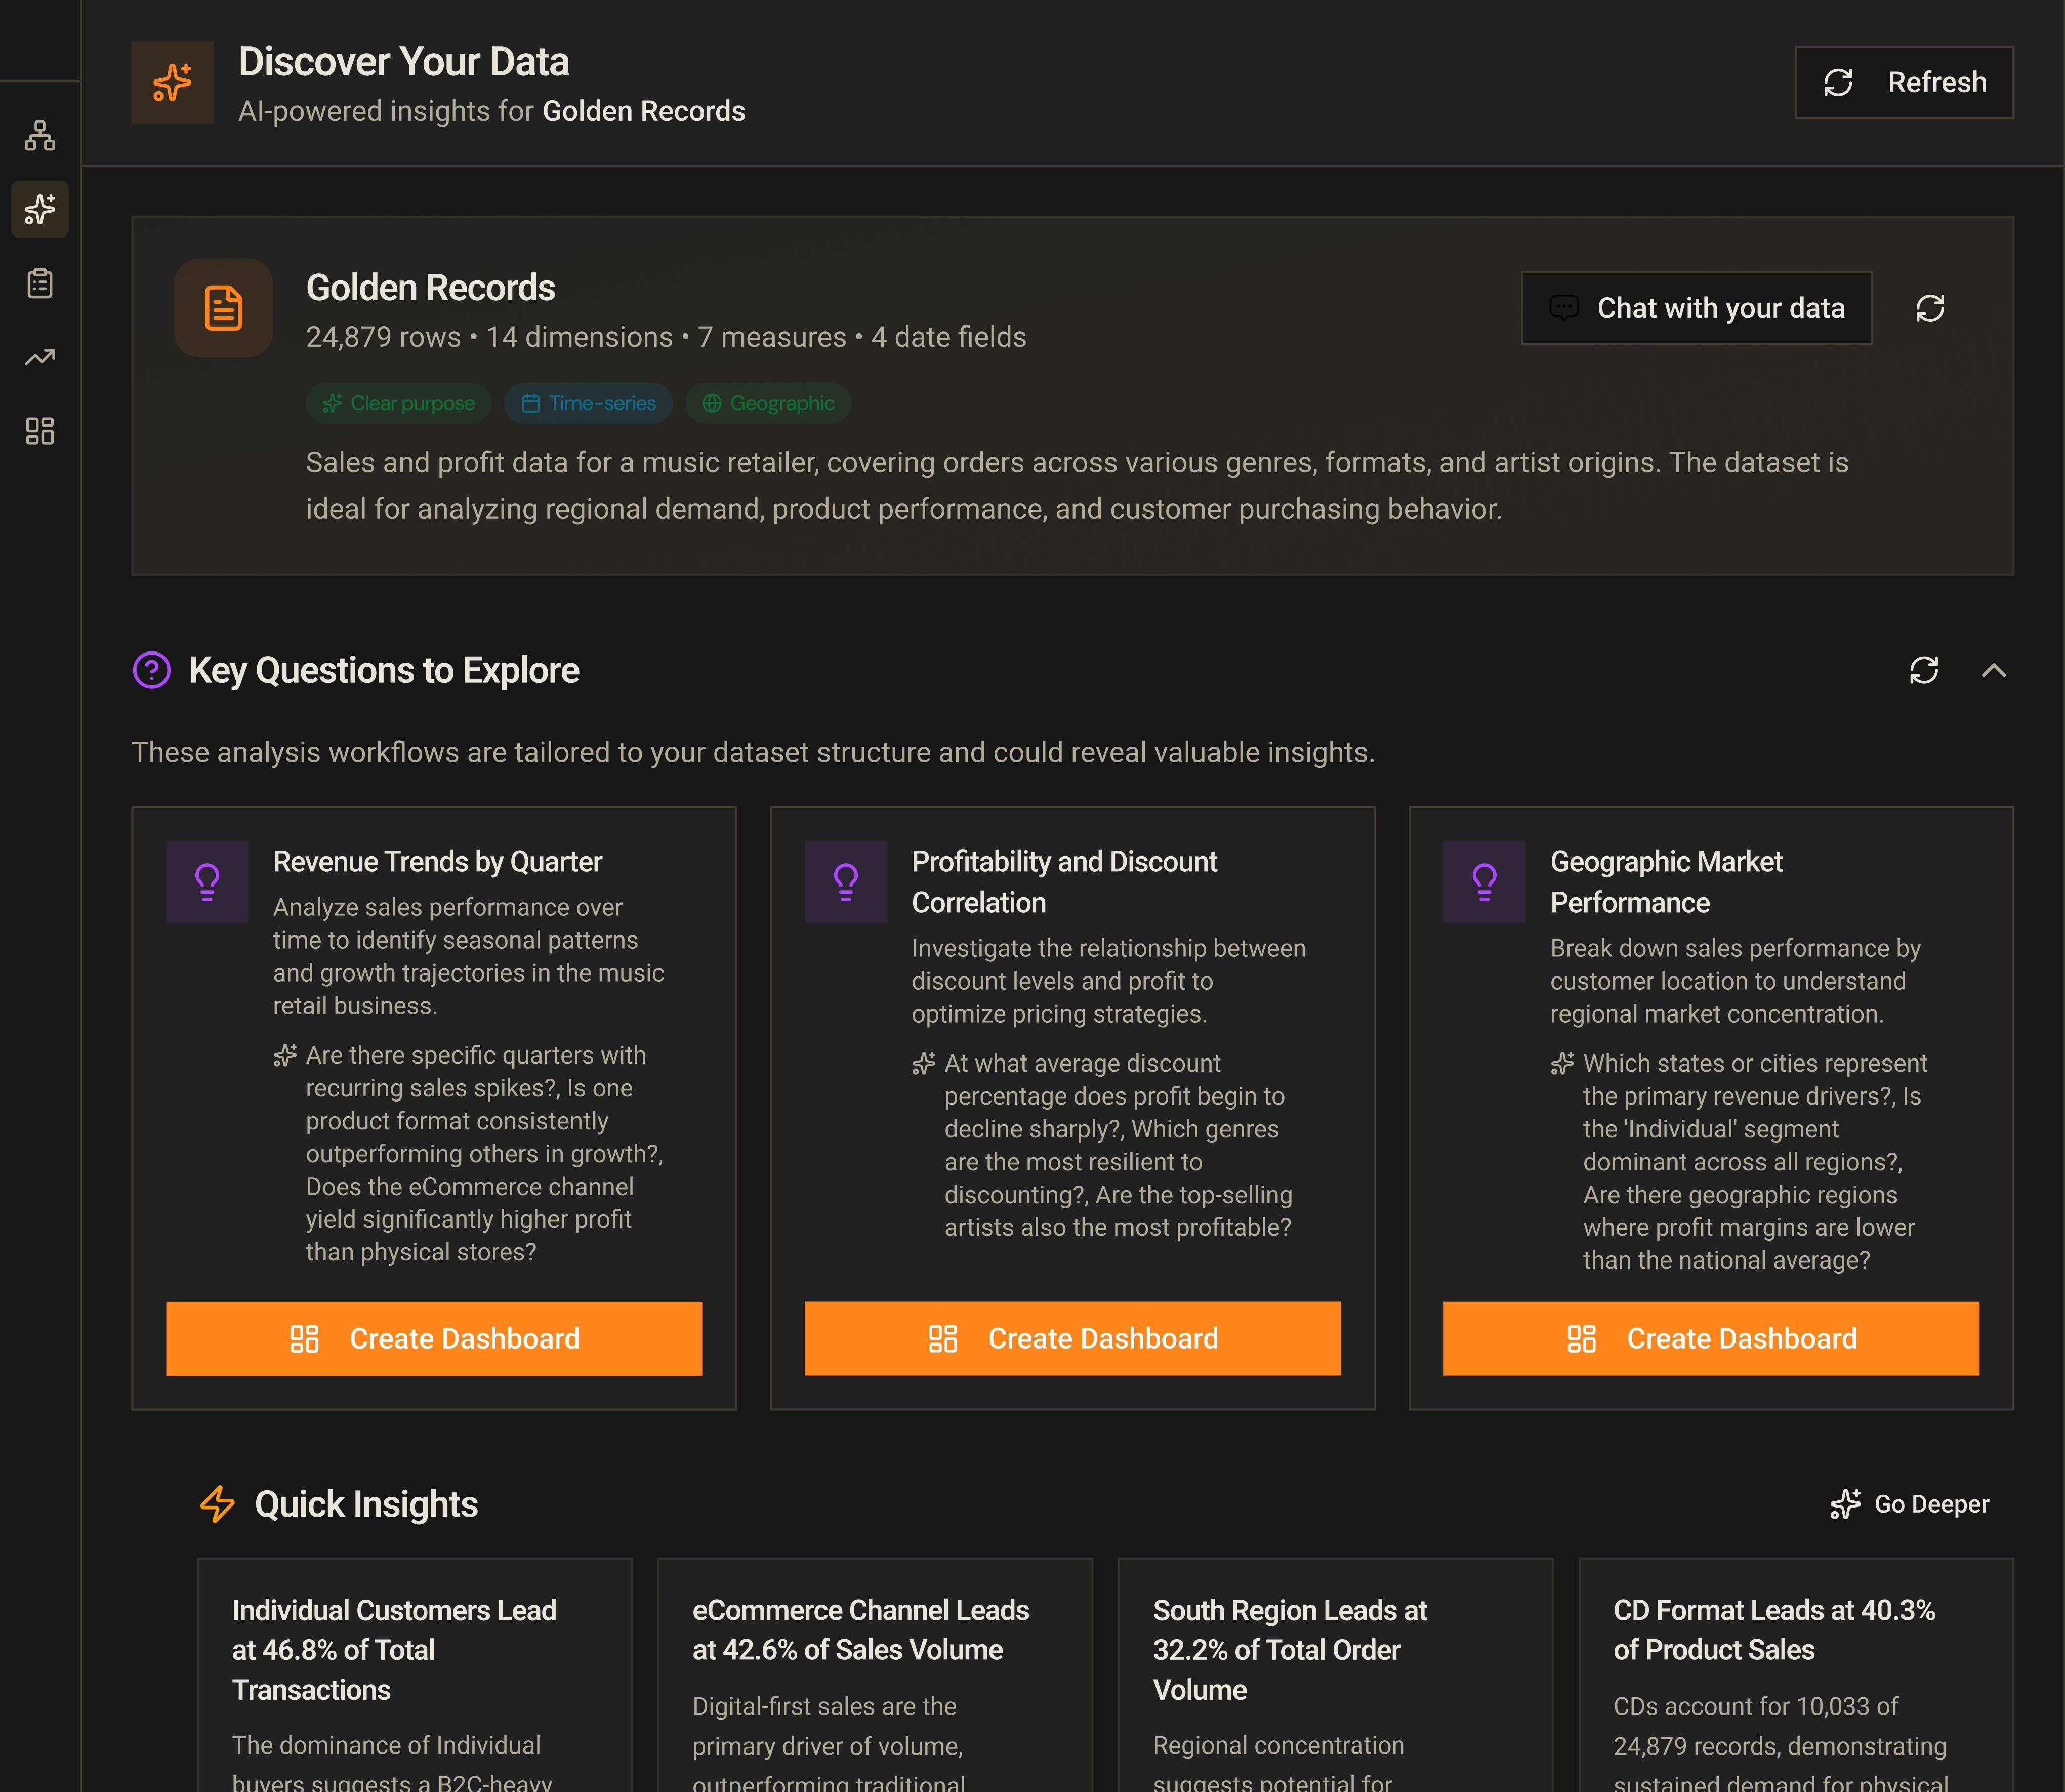
Let the Data Tell You Where to Start
Staring at a spreadsheet doesn’t tell you what’s significant. Golden’s AI reads your data and surfaces the patterns that deserve your attention — before you’ve asked a single question.
- AI-generated key questions — Golden identifies the most analytically interesting questions your specific dataset can answer, so you’re not starting from a blank canvas
- Quick insights — automatically detected trends, anomalies, and patterns in your data
- Suggested visualizations — chart recommendations tailored to your actual data shape and field types — not generic suggestions, but ones that make sense for your data
- Dataset summary — a plain-language description of what you’re looking at, written by AI
Clean, transform, and enrich — without writing code.
Messy data is inevitable. Golden makes fixing it fast, reproducible, and something your whole team can do — not just engineers.
Clean in Bulk, With Confidence
Data cleaning is tedious when it means touching every cell manually. Golden’s Smart Clean wizard examines your data, identifies the most impactful fixes, and applies them in bulk — while showing you exactly what changed and why.
- Smart Clean wizard — AI detects quality issues across your dataset and suggests fixes you can apply with one click
- Trim whitespace and fix mixed casing
- Fill nulls with sensible defaults
- Find and replace values across an entire column
- Remove duplicate rows
- Clip outliers and normalize skewed distributions
Transform Without Writing SQL
Every analyst has a mental checklist of transformations they apply to every new dataset. Golden makes that checklist a library.
- Split one column into multiple (by delimiter, pattern, or position)
- Merge and concatenate columns
- Convert data types and parse date formats
- Extract date components — year, month, quarter, week
- Apply math operations, rounding, and custom calculated expressions
- Write conditional logic (if/then/else rules) without any syntax
- Use regex for extraction and replacement
- Parse nested JSON into flat columns
- Enrich your data with lookup joins to another table
AI Does the Hard Parts
Some transformations require understanding the meaning of your data, not just its structure. Golden’s AI capabilities handle the cases where rules alone aren’t enough.
- AI column extraction — give Golden a column of messy free text and tell it what you want to pull out; it extracts structured fields automatically
- Text analytics — automatically score sentiment, identify named entities, and categorize free-text columns
- Improve field names — AI rewrites cryptic column names into readable labels
- Suggested transformations — after profiling your data, Golden recommends the most useful transformations, ranked by impact
Reproducible by Default
The work you put into cleaning a dataset shouldn’t be lost the next time you get a new file. Every transformation you apply is recorded as a step in a Recipe — a named, replayable sequence of operations.
- Save prep recipes and reapply them to new data in one click
- Full transformation history with step-by-step undo — nothing is permanent until you decide it is
- Live preview of every change before it’s applied
- Import and export data dictionaries to carry field metadata across projects
Every chart type. No limits on complexity.
Golden’s visualization builder is designed for the analyst who knows what they want to see — and for the one who’s still figuring it out. Powerful enough for experts, fast enough for everyone.
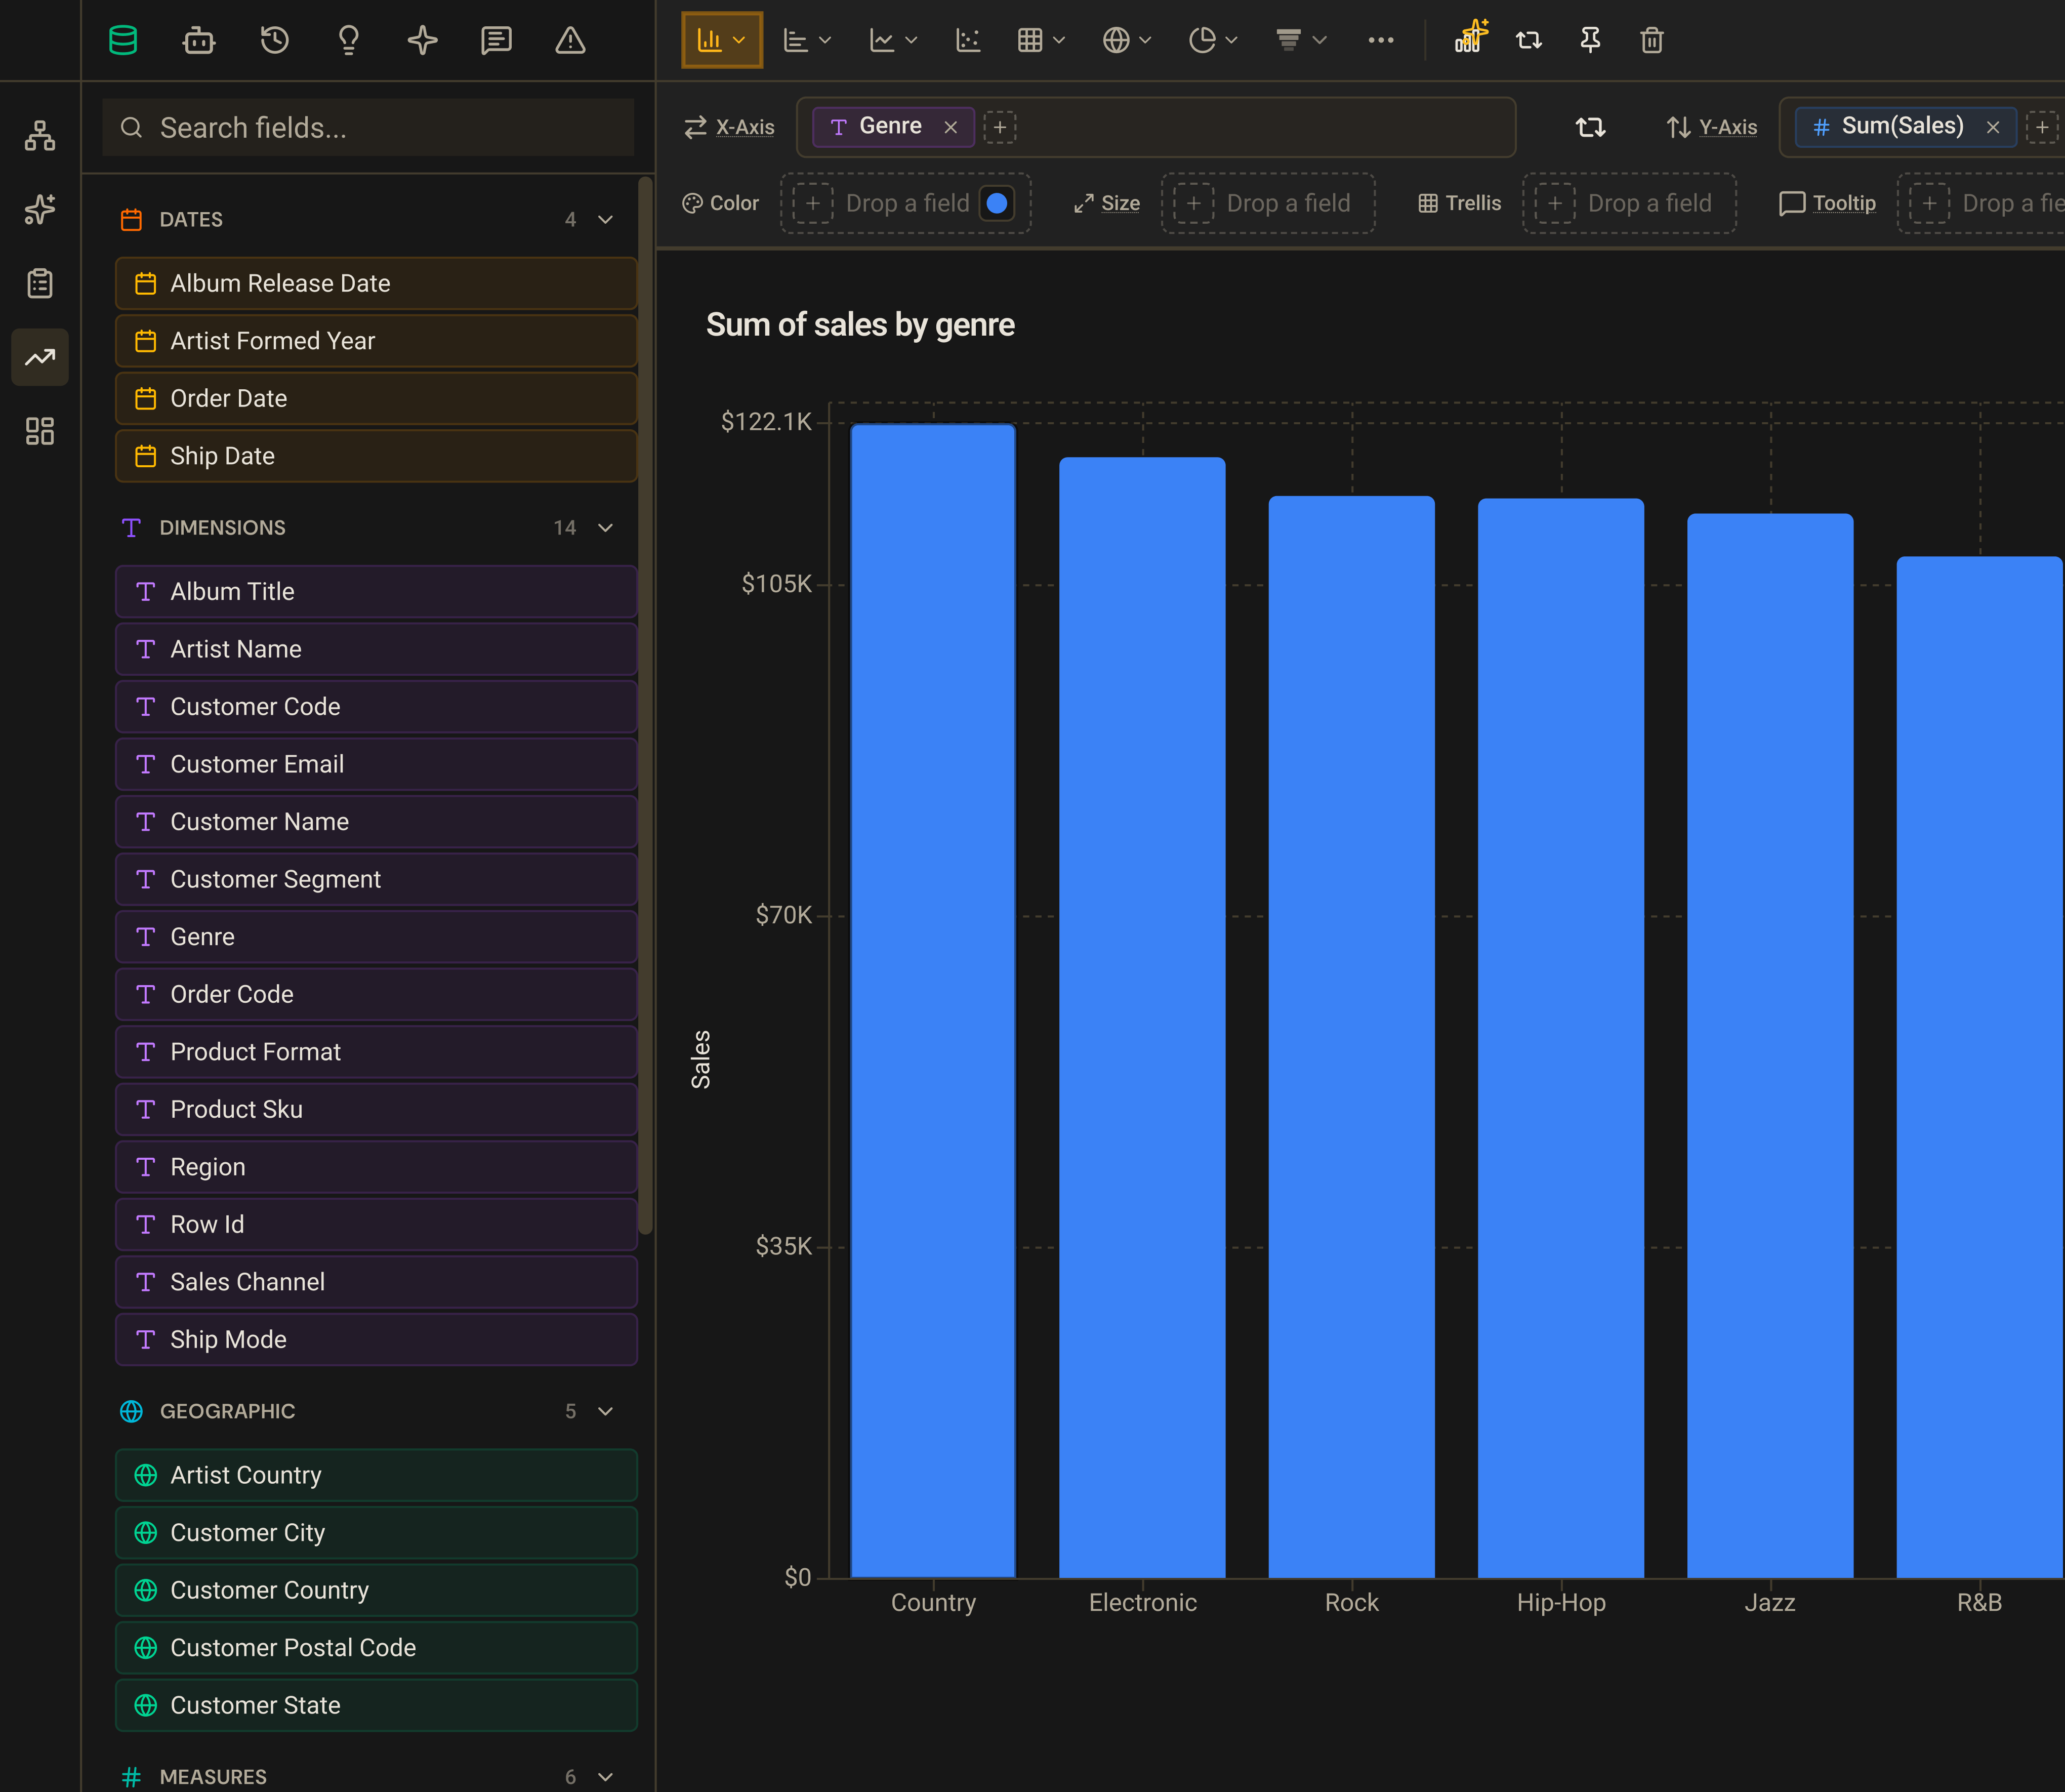
Build Charts the Way Analysts Think
Golden’s shelf-based builder follows the same mental model that expert analysts already use: drag dimensions and measures onto encoding channels — rows, columns, color, size — and the chart updates instantly. There’s no “chart type first” constraint; the right chart type emerges from the data you’ve placed and how it’s structured.
For analysts who want to move even faster, the AI Analyst lets you describe what you want in plain English — “show me monthly revenue by region as a stacked bar” — and Golden builds the visualization, applies the right aggregation, and routes the result to the correct chart type automatically.
- Drag-and-drop shelves — rows, columns, color, size, trellis
- Intelligent defaults — Golden infers the right aggregation, axis scale, and color scheme for your data
- AI Analyst — natural-language questions become finished visualizations
35+ Chart Types — The Right Tool for Every Question
A limited chart library means finding workarounds. Golden covers every common visualization type and the specialized ones analysts reach for when standard charts aren’t enough.
- Bar & Column: Bar, Stacked Bar, 100% Stacked Bar, Horizontal Bar, Lollipop, Waterfall,
- Line & Area: Line, Area, Stacked Area, 100% Stacked Area, Combo (dual-axis)
- Part-to-Whole: Pie, Donut, Treemap, Funnel, Sankey, Sunburst
- Correlation: Scatter
- Survey: Diverging Bar, Range Bar
- Distribution: Box Plot, Histogram, Word Cloud
- Radial: Radar, Radial Bar, Stellar, Radial Lollipop
- Geographic: Shape Map, Filled Map, Density Map
- Tables: Interactive Table, Pivot Table, Matrix Heatmap
- KPIs & Metrics: Big Number with sparkline
- Specialized: Scatter, Gantt, Retention
Go Beyond a Single Chart
Individual charts answer individual questions. The real insights come from looking at data across multiple cuts simultaneously — and from being able to act on what you see.
- Trellis / small multiples — split any chart into a grid of panels across a dimension, so you can compare patterns across segments without creating multiple separate charts
- Drill-down — click any data point to explore the next level of detail, with a breadcrumb trail so you always know where you are
- Calculated fields — write custom expressions using your data’s fields and apply them as first-class dimensions or measures
- Visual calculations — apply running totals, moving averages, percent of total, rank, and period-over-period comparisons (vs. prior period, month, quarter, or year) as instant computed fields — no SQL required
Filters That Actually Work
Filtering is the most common analytical operation and the most commonly frustrating one. Golden’s filter system handles every data type correctly and lets you save the combinations you use repeatedly.
- Categorical, numeric, date/time, boolean, and Top-N filters
- Relative date filters that update automatically (last 30 days, this quarter, year-over-year)
- Saved filter sets — name and reapply your most-used filter combinations
- Filter from the chart — click a legend item or bar to filter by it instantly
Make Your Analysis Presentation-Ready
An analysis isn’t done until it can stand on its own. Golden’s formatting tools go deep enough to produce publication-quality output without ever leaving the builder.
- Reference lines — annotate charts with targets, averages, and thresholds
- Chart annotations — add text notes and callouts to specific data points
- Format pane — control fonts, colors, label formatting, tooltip content, axis ranges, and more
- Analysis history — every state is saved; undo and redo any decision
From data to story in minutes.
The insight that stays in a spreadsheet doesn’t change anything. Golden gives you three ways to communicate what you found — choose the format that fits your audience.
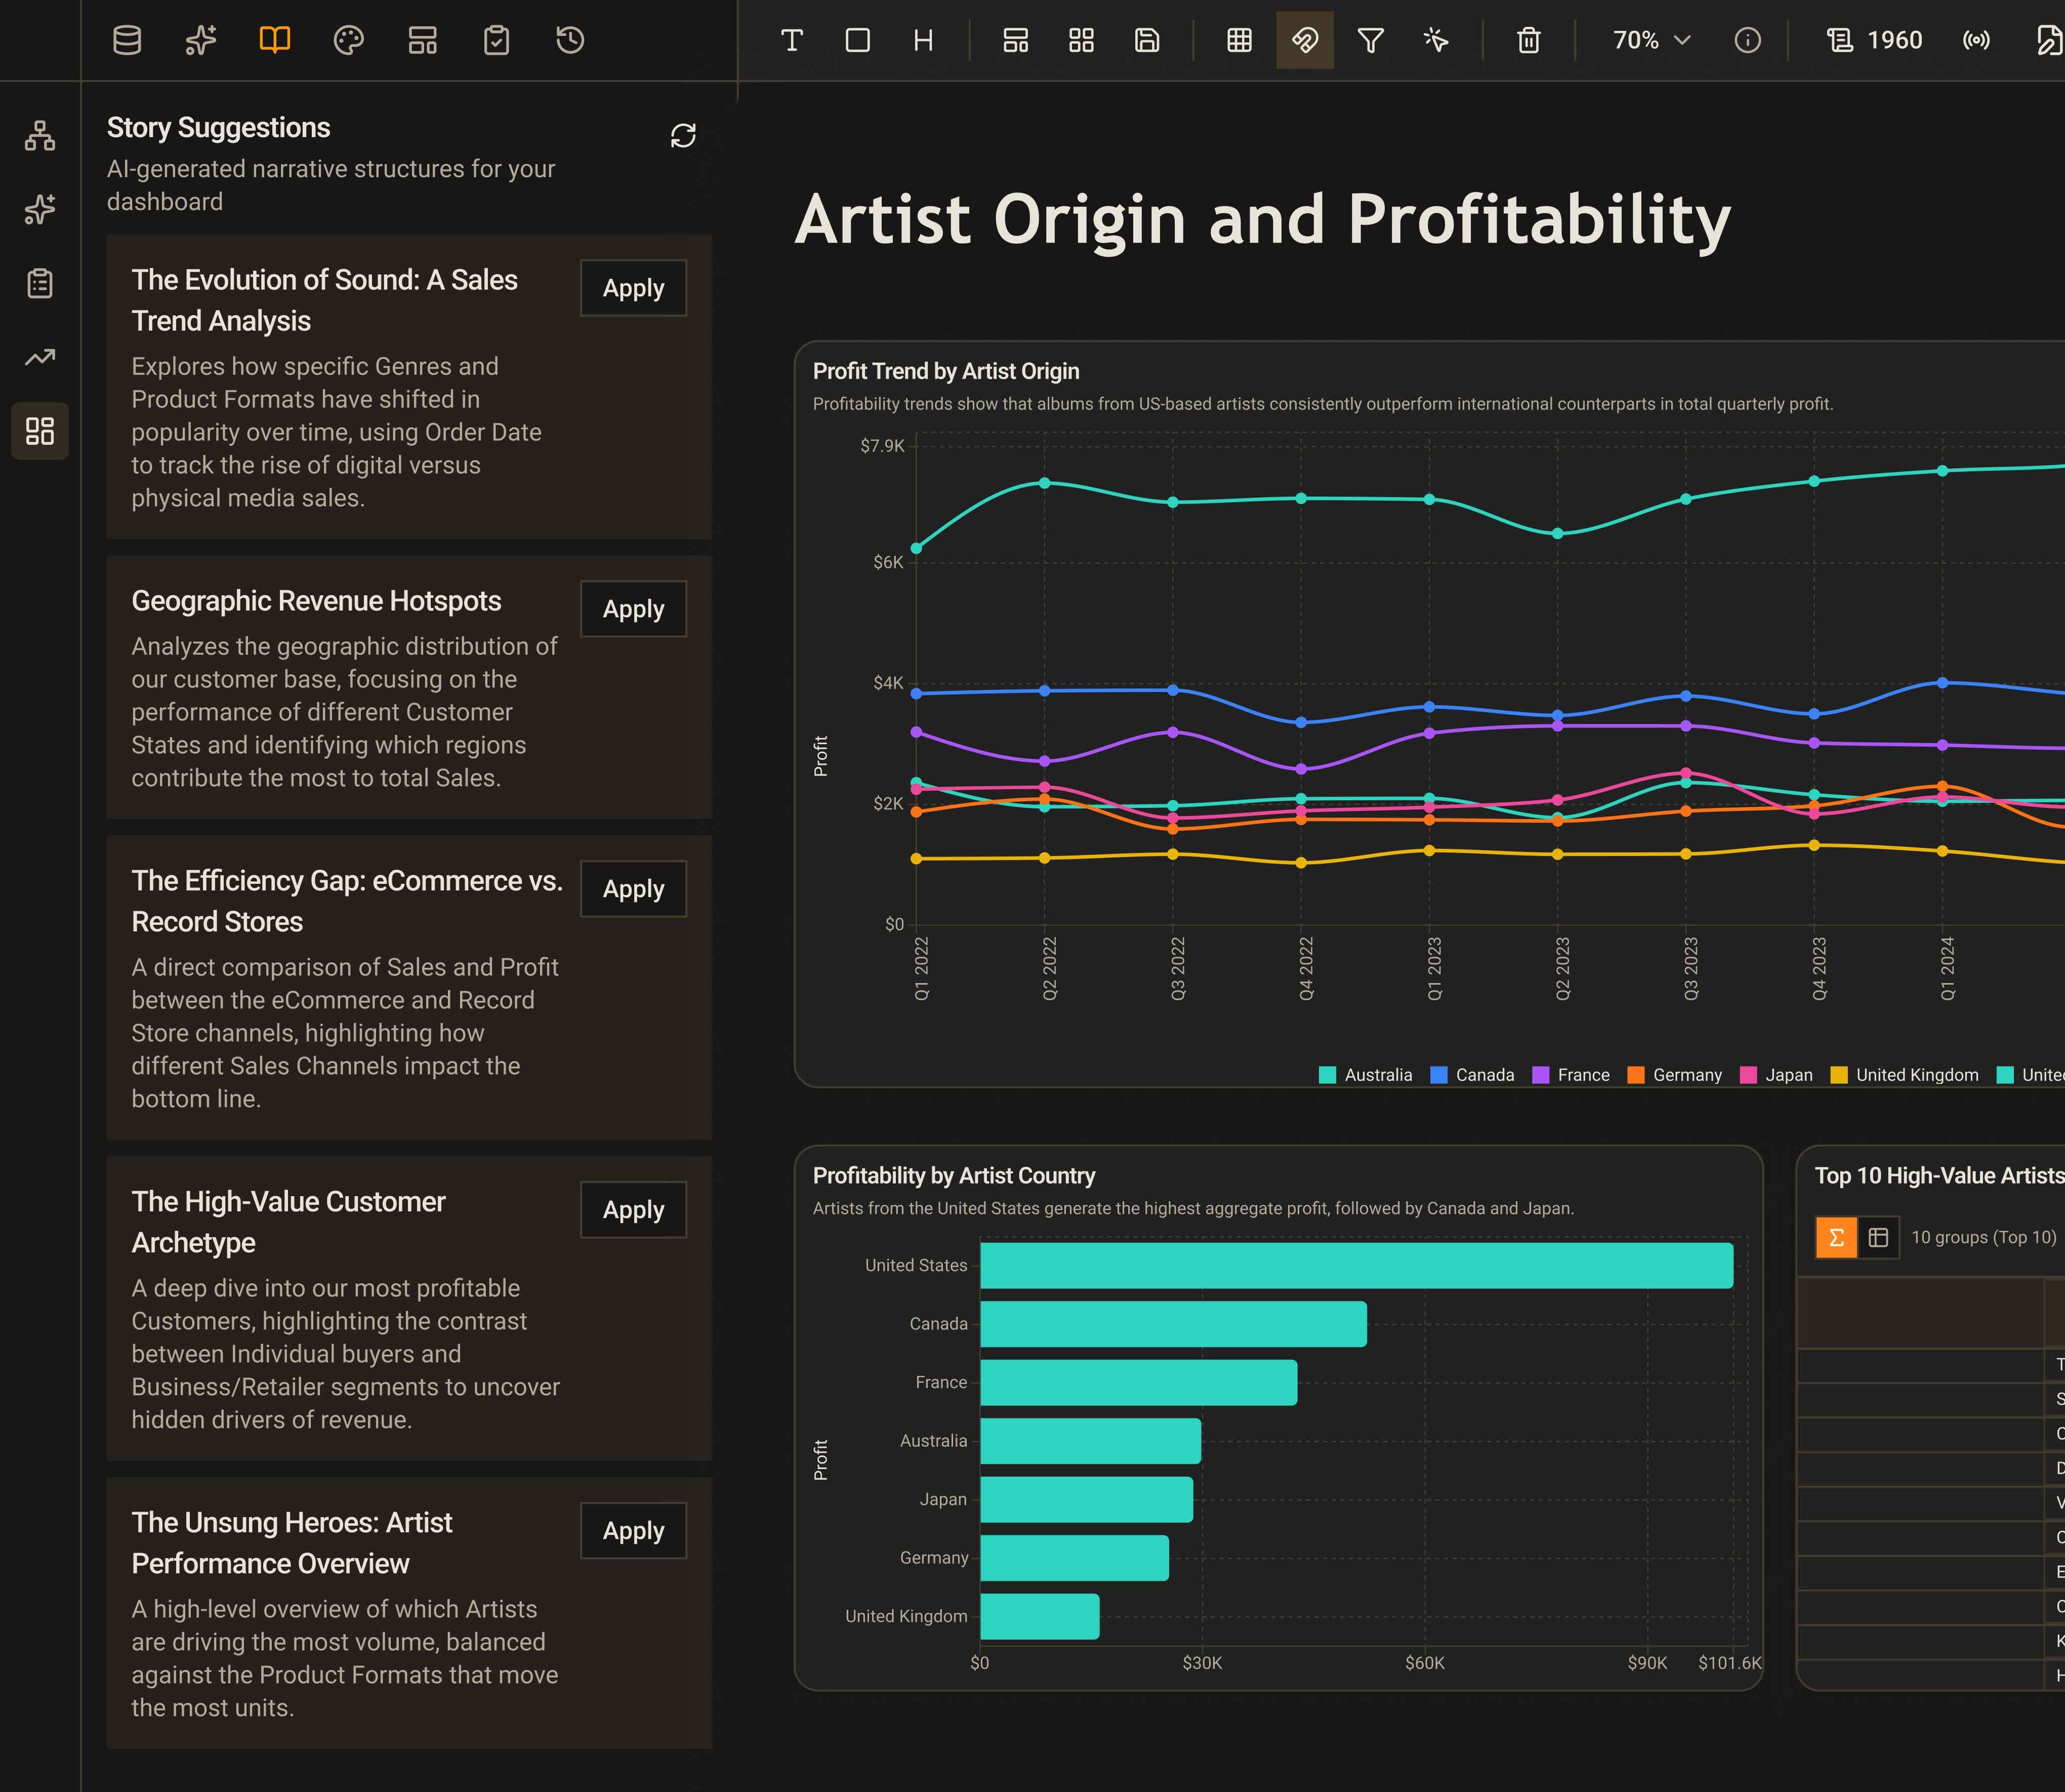
Dashboards — Built for Decision-Making
Dashboards fail when they’re cluttered, confusing, or out of date. Golden’s dashboard builder is designed to produce the kind of dashboards people actually use: clean, interactive, and always live.
The canvas is fully freeform — drag and resize components to any size and position, with optional snap-to-grid for alignment or pixel-precise free placement. Every chart on a dashboard is a live query, so when your data changes, the dashboard updates automatically.
- Freeform drag-and-drop canvas with pixel-precise positioning
- Rich component library: charts, KPIs, tables, maps, filter slicers, images, text blocks, callouts, sparklines, progress bars, timelines, and more
- Dashboard-level filters and slicers that keep every component in sync
- AI-generated layouts — describe the dashboard you want in plain English and Golden assembles an initial layout, complete with the right component types and data connections
- Brand customization and theme control
Get insights in front of the people who need them.
An analysis that doesn’t reach the right people doesn’t create value. Golden makes it easy to collaborate and share work at the right level of access — across your team, with stakeholders, or in the tools they already use.
Spaces — Organize Work Around Your Team’s Needs
As you create more analyses, dashboards, and reports, discoverability becomes the bottleneck. Spaces are curated collections — you decide what belongs in each space, who can see it, and what they can do with it.
Use a Space to organize everything related to a business area (marketing analytics, finance reporting), a project (Q3 planning), or a team. Private spaces keep personal work out of shared feeds; shared spaces make it easy for anyone on the team to find and build on what already exists.
- Shared Spaces for team-wide work, private Spaces for personal analysis
- Role-based access: viewer, editor, and admin permissions at the Space level
- Invite teammates by email — they only see what they’re meant to see
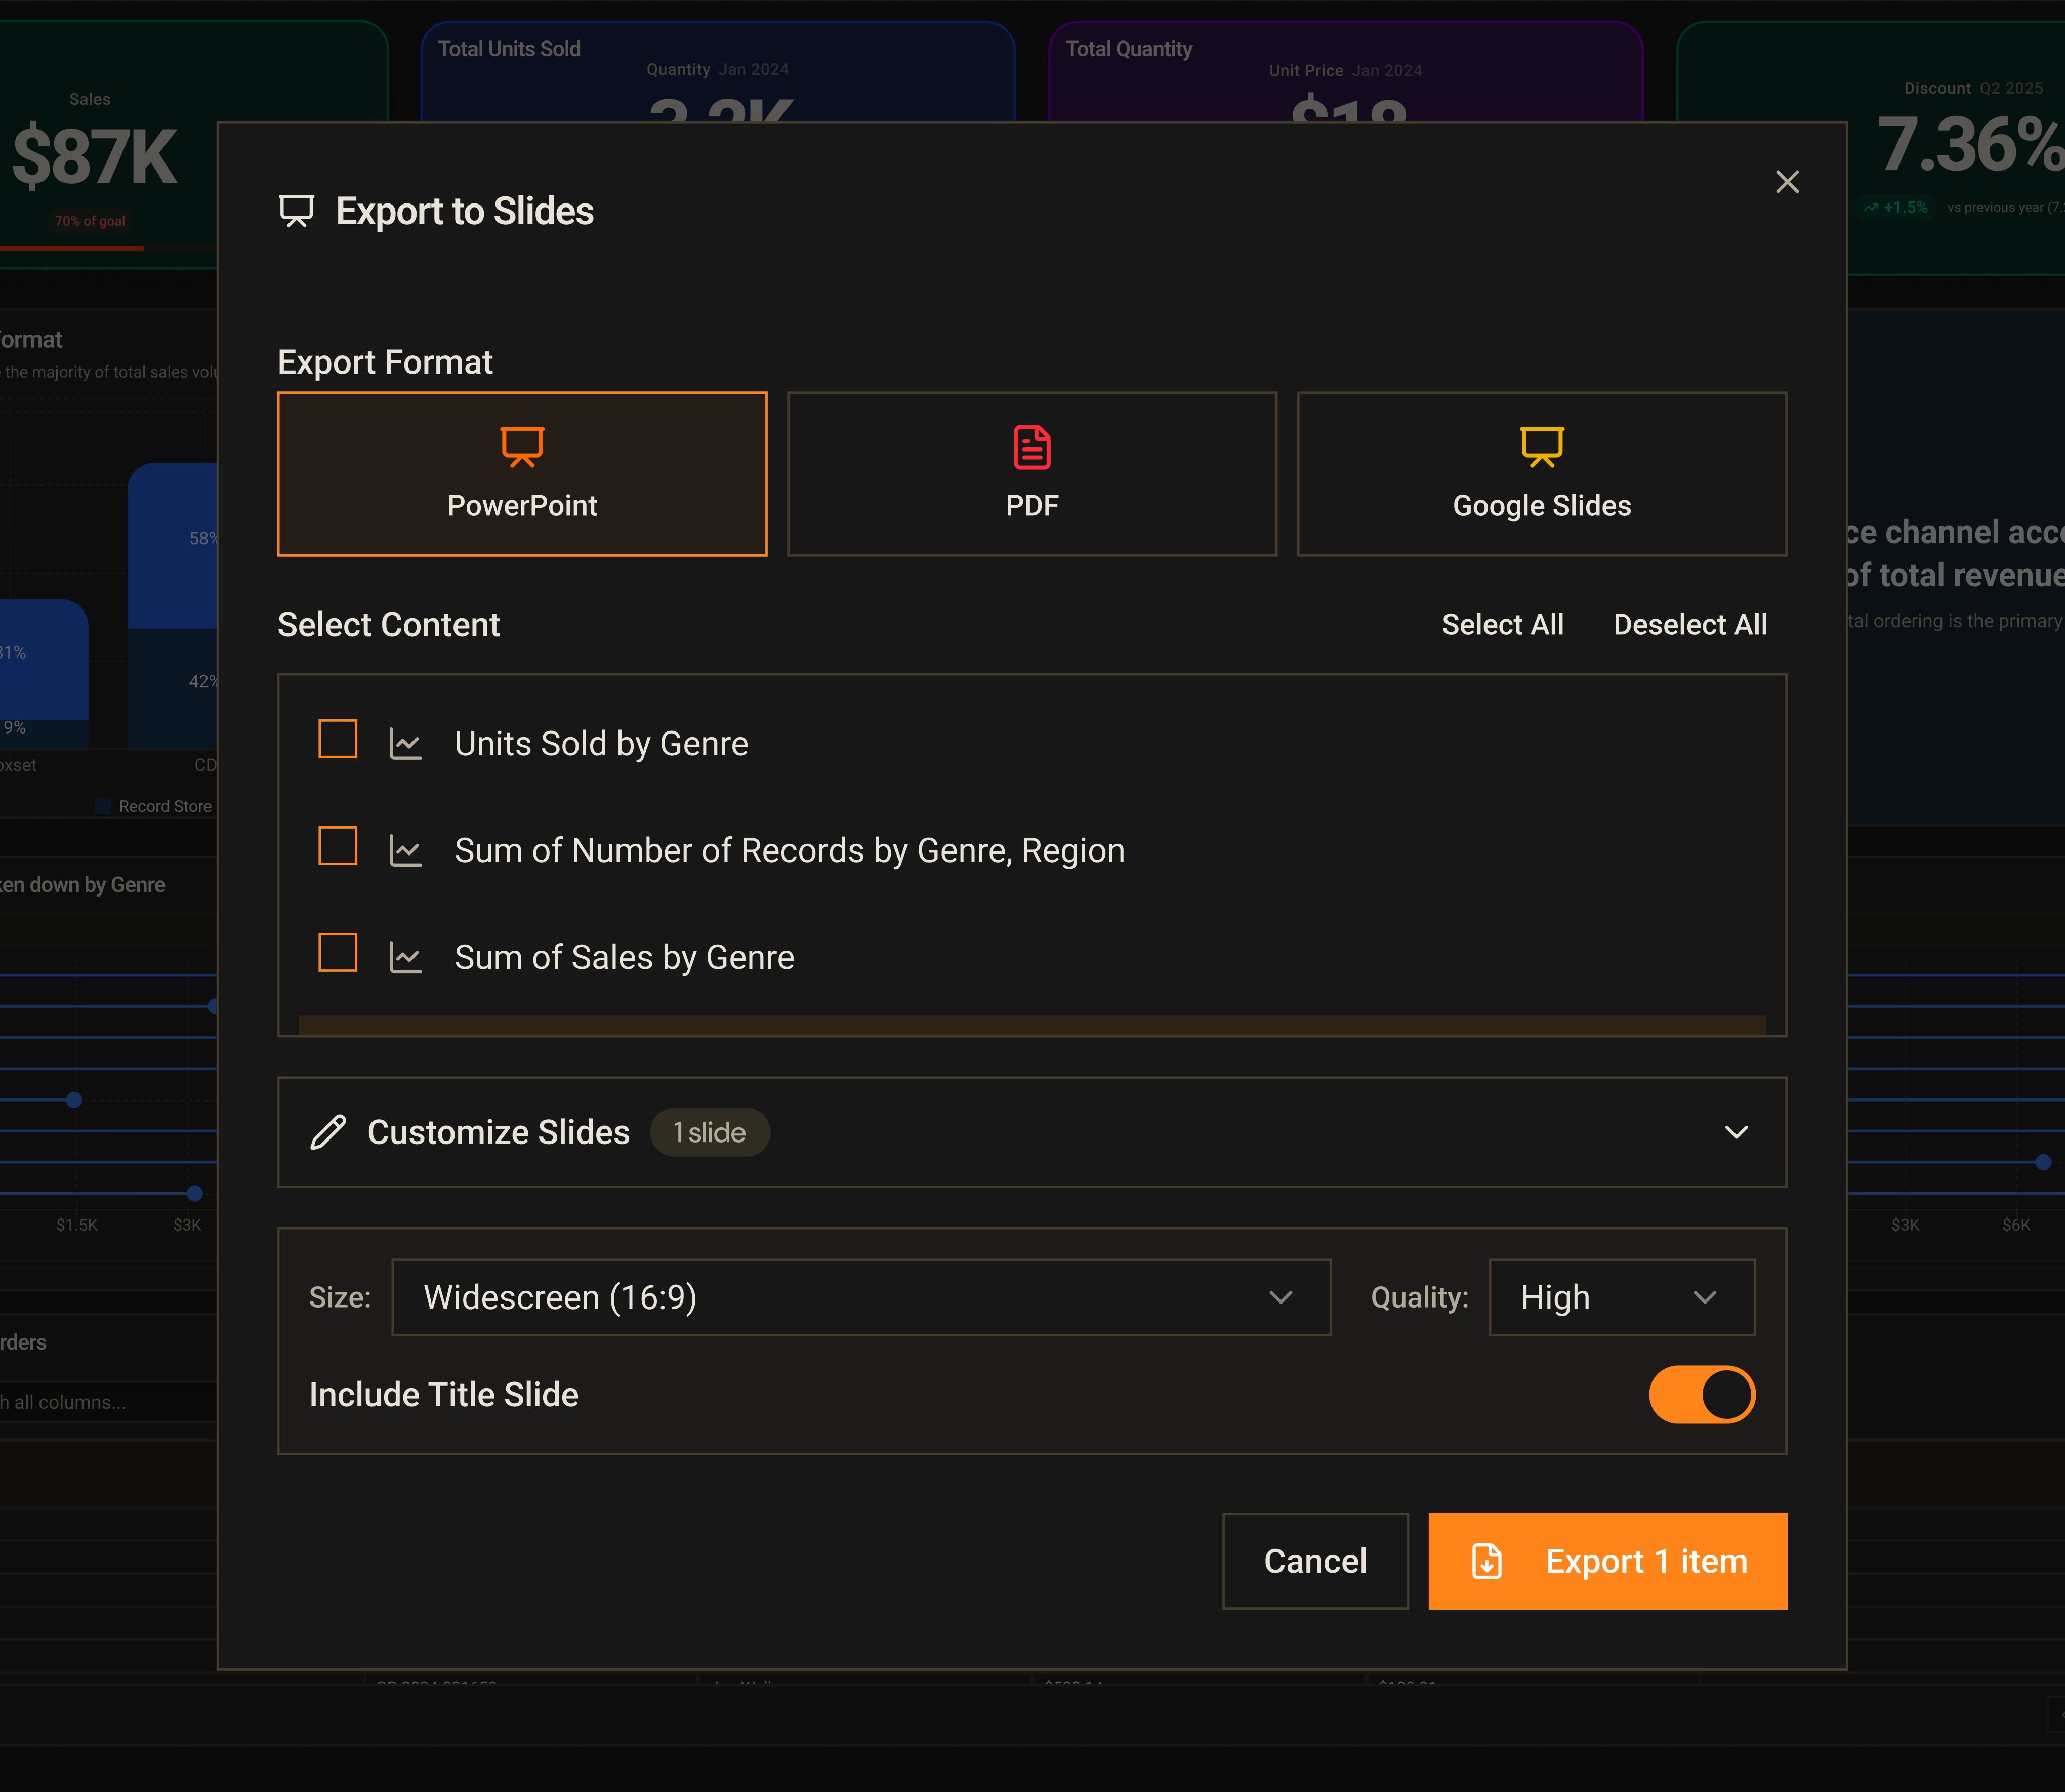
Export — Take Your Work Anywhere
Sometimes people need the file, not the link. Golden exports every output format that your stakeholders expect.
- Export full dashboards rendered at high resolution, ready to share, present or email - Output to PowerPoint, PDF, PNG and Google Slides
- Export the underlying data from any visualization for stakeholders who live in spreadsheets - Output to Excel, CSV, and Google Sheets,
Collaboration
Sharing isn't just about output formats — it's about keeping the right people in the loop throughout the process, whether you're working together in real time or handing off finished work.
- Share individual analyses, dashboards, and documents with specific teammates — control who can view, edit, or administer each workspace, so collaborators can build freely and stakeholders can’t accidentally change anything
- Real-time co-editing - see who else is in a session with live presence indicators and cursor tracking, so you're never overwriting each other's work
- Share to Slack - send any chart or dashboard directly to a channel or DM, with a thumbnail preview and a link back to the live analysis in Golden
Fast pace of innovation
We ship fast and we ship often.