
Golden vs Power BI
When modeling data, writing measures and managing workspaces takes up your day, there is less time to investigate what the numbers mean. Golden helps you move from a business question to an analysis your team can use. Describe what you need, let AI draft the dashboard and narrative, then review and refine the result directly.
Why do teams move from Power BI to Golden?
If your team spends more time building reports, explaining results, and managing licenses and capacity than it wants to, those are practical problems your next platform should address. Golden combines AI-assisted analysis, dashboard creation, and sharing in one workflow, with authoring and AI included in every seat.
| Reason | Power BI | Golden Analytics |
|---|---|---|
| 01Speed | Fast to open, slow to author. Model in Desktop, publish to the Service, then schedule the refresh before anyone sees it. | Two clicks to a finished dashboard. Fast to build, fast to render. |
| 02Depth | DAX is powerful and unforgiving. The common patterns become measures most of the team can't write or check. | Running comparisons, top-N with an "other" bucket and cohort analysis are built in. No expert required to get an answer. |
| 03Trust | Copilot drafts beside the report, and what it produces still has to be checked against the model you built by hand. | Every action, typed or clicked, runs through the same validated logic. We never train models on customer data. |
| 04Collaborate | Every viewer needs a Pro or PPU seat unless the content sits on an F64 capacity. Workspaces, apps and capacity all have to line up. | Spaces put the work where the team already is. Every seat can open, ask and explore what's shared, with no license mapping in between. |
| 05AI-native | AI added on top. Copilot needs the report's workspace on a paid Fabric capacity and drafts inside the classic authoring model. | AI-native. The AI and the human are peers, and both flow through the same logic. |
| 06Simple | Pro is $14 a seat and Premium Per User $24. Fabric capacity starts around $263 a month pay-as-you-go, and F64, where free viewers can open reports, runs about $8,400. | $24 a seat for Team, $36 for Enterprise, billed annually. Authoring, sharing, exploration, consumption and AI are all included. |
Reduce the manual work between a question and a dashboard
When a stakeholder needs an answer, building the report can become a separate project: shape the model in Desktop, write the measures, publish to the Service, set up the refresh. Golden surfaces suggested questions and visualizations, lets you explore follow-ups in plain language, and carries the resulting charts into a dashboard. You can develop the analysis and its deliverable together. Ask Golden to generate the dashboard, then adjust the calculations, charts, and layout directly. AI handles the initial build while you review the results and shape the explanation for your audience.
How Golden gets there →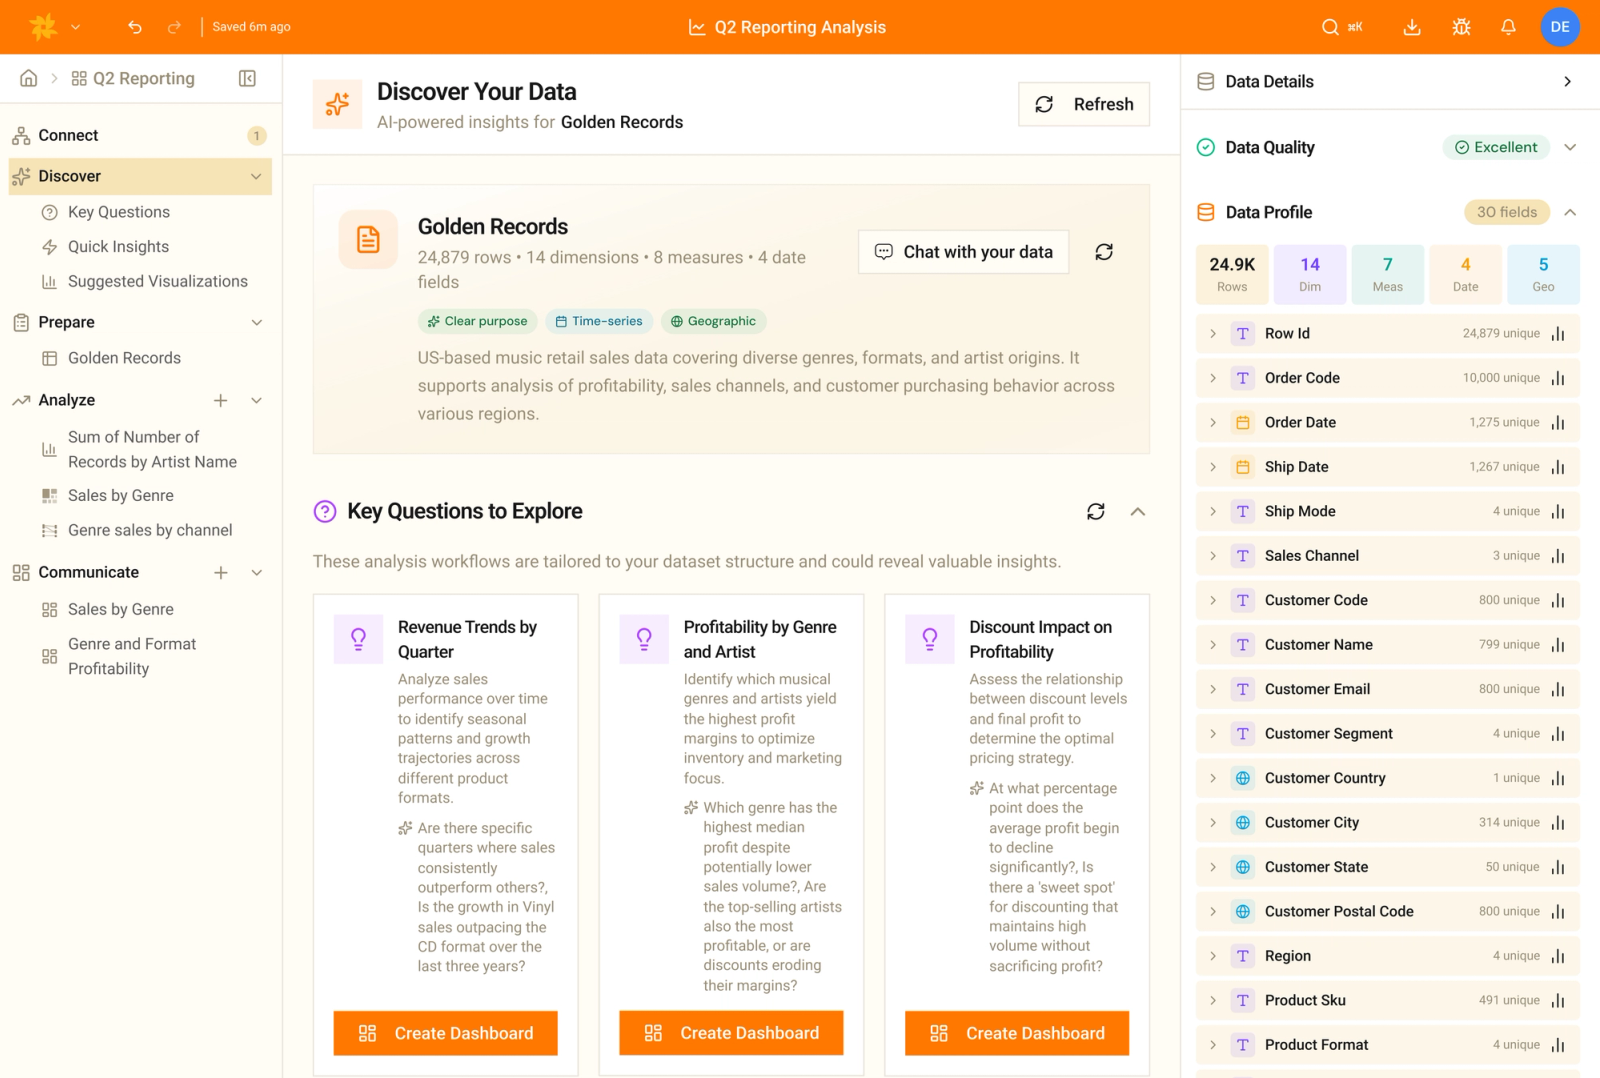
Answer common business questions without building every calculation from scratch
Questions about retention, top performers, and changes over time come up repeatedly. Golden supports these analytical patterns and provides natural-language help for more complex calculations, so you can work on the business question within the analysis you already have open.

In Golden: use cohort retention analysis to investigate whether customers return over time, with natural-language help for the calculations you need.
In Power BI: write DAX measures over a date table to assign cohorts and count returning customers, adjusted to your data and retention definition.

In Golden: use built-in top-N filters to identify leading products, customers, or regions and focus your analysis on the highest-ranked values.
In Power BI: a visual-level Top N filter covers the leaders; grouping the remaining values as “other” typically takes a RANKX or TOPN measure and a supporting table.

In Golden: apply a visual calculation to compare performance with a prior period, month, quarter, or year, helping you establish what changed.
In Power BI: use quick measures or time intelligence functions such as SAMEPERIODLASTYEAR, with a marked date table and filter context set up for the comparison you need.
Verify the analysis before others rely on it
An AI-generated answer still needs your review, especially when colleagues will use it to make a decision. Golden lets you inspect generated calculations and trace numbers to their source, giving you the information you need to check the logic and explain the result.
Correct and refine the result directly
When a draft needs a different calculation or chart, you can make that change directly. Golden combines AI-assisted building with manual editing, so you can correct and refine the work without regenerating the entire dashboard.
Your data stays yours
We don't train models on customer data. Golden selects from multiple models for different tasks and works with schema, statistics, and a small data sample. Talk with us about your data-handling requirements as part of your evaluation.
Let colleagues build on shared work without adding licenses or capacity
Power BI: match licenses and capacity to the audience
Content in a workspace is shared with colleagues who hold a Pro or Premium Per User license, unless the workspace sits on an F64 or larger capacity, where free users can view it. Copilot requires the workspace to run on a paid Fabric capacity. Licenses, workspace roles, and capacity need to line up with what each colleague will do.
Golden: one seat model, shared Spaces
A colleague who starts by viewing a report may later need to explore the data or contribute an analysis. Golden includes authoring in the same seat. Organize the work in Spaces and grant the appropriate permissions, so that change in responsibility does not require a different license or a larger capacity.
What does "AI-native" actually mean?
There's a simple test. Ask what happens if you remove the AI. Take Copilot away and Power BI is still Power BI. Remove Golden's AI and the product no longer makes sense.

Golden: AI in the foundation
Whether you change a chart by clicking a menu or by typing "make this a line chart," both actions flow through the same validated logic. Ask for a dashboard and you get a finished, styled dashboard that's ready to share.
Power BI: AI on top
Copilot is real engineering. But the interaction model (writing DAX and dragging fields onto a canvas) was designed long before AI showed up. The human is the only author. The AI drafts, you go fix the measure.
Simple pricing. Simple to get started.
Golden makes it easy, from our simple pricing model, no hidden fees or token add-ons, and no hassle managing users across different license types.
| Per user, per month | Power BI | Golden Team | Golden Enterprise |
|---|---|---|---|
| Full authoring | $24 (Premium Per User) | $24 | $36 |
| Exploration | $14 (Pro) | Included | Included |
| Consumption | $14 (Pro), or free on F64 capacity | Included | Included |
| AI agent | Copilot requires a paid Fabric capacity (F2 or larger), on top of seat licenses | Included | Included |
| License planning | Match every seat to a capacity before you share | One seat does all four | One seat does all four |
Golden vs Power BI FAQs
What does "AI-native" really mean here?
It's an architecture, not a feature. A change you make by clicking and a change the AI makes both run through the same validated logic. Ask for a dashboard and you get a finished one, not a wireframe.
We have years of Power BI reports. Is switching painful?
You don't rebuild everything on day one. Golden connects to the warehouse and models you already have, so you can run it beside Power BI, move the reports that matter most, and let the long tail age out.
Isn't Power BI unbeatable on price?
$14 looks unbeatable until every viewer needs a seat too, and Copilot needs a paid Fabric capacity underneath it. The sticker price is per editor; the bill is per person who opens the report.
How is Golden simpler than Pro, PPU and Fabric?
Power BI splits capability across Pro, Premium Per User and Fabric capacity, and Copilot only runs on a paid capacity. A Golden seat is $24 on Team and $36 on Enterprise, billed annually, and includes authoring, sharing, exploration, consumption and AI with no capacity to size.
What about our data and which AI models you use?
Golden uses all the major models so the right one gets used for the job, and we don't train on any customer data. We work from schema, statistics, and some clever techniques to keep the experience fast and safe.

Bring one question. We'll show you the day-and-night difference.
Pick a report your team keeps rebuilding in Power BI. Ask Golden the same question in plain language.
Pricing, product names, and feature details reflect publicly reported information as of October 2026 and are subject to change. Power BI figures are Microsoft list rates effective April 2025: Pro $14 and Premium Per User $24 per user per month, paid yearly. Fabric capacity figures are US pay-as-you-go rates; reserved pricing is lower and rates vary by region. Last reviewed October 2026.