What changed, and why?
Time series analysis explains how a metric changed over time and estimates what comes next. Golden finds the turning points, identifies the segments behind each swing, and backtests the forecast on your history.
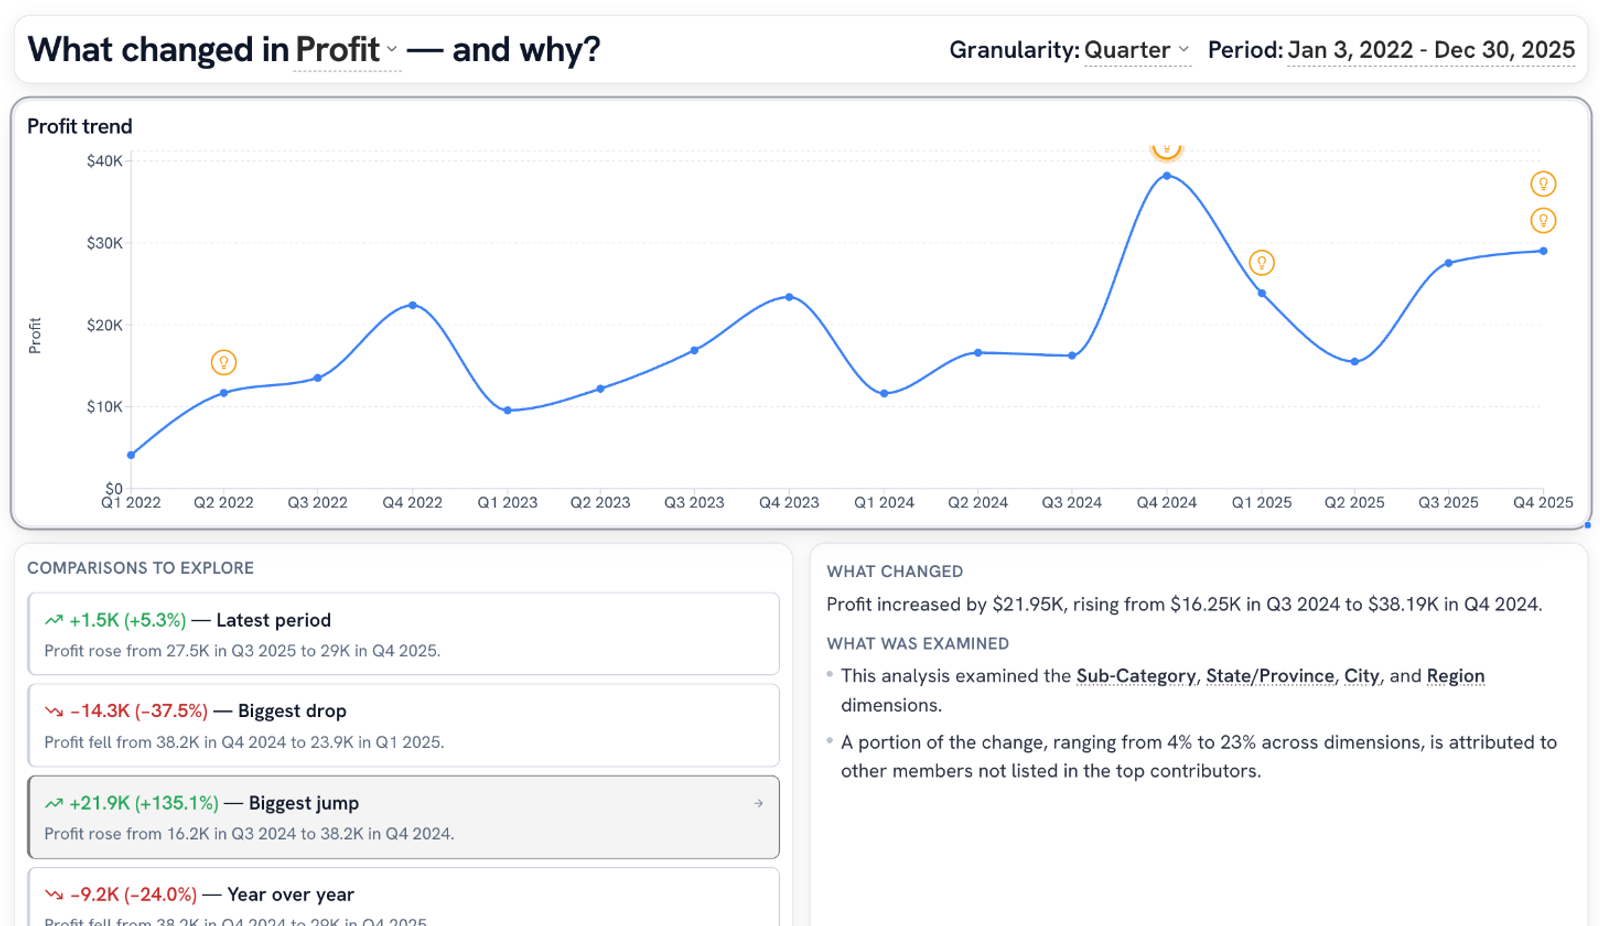
The line goes down. Now what?
Every business question is a time question. Did we grow? Compared to when? Is this dip normal for August, or is something broken?
The line chart answers the first one. The rest used to cost an afternoon of rebuilding the same pivot by region, then product, then channel.
Every swing comes with its explanation
Golden finds the moments in your trend worth talking about, then runs all those pivots for you and hands back the cuts that explain each one, in real units.
When you're ready to look forward, it forecasts with intervals tested against your own history, and it won't forecast at all when the history is too thin to be honest about.
How it works
Pick a measure and a grain
Profit by quarter. Sales by month. Golden builds a whole board around it in one click.
It finds the moments worth explaining
Latest period, biggest drop, biggest jump, year over year, biggest % swing. Up to 5 comparisons, flagged right on the trend line. Half-finished periods never get ranked, so this month's partial numbers don't read as a crash.
Click a moment, get the why
Pick Biggest jump and the board re-anchors on it. Profit rose 21.9K from Q3 to Q4 2024. Binders added 9.9K, Copiers 8.3K, Machines took 6.3K back. Drivers, offsets, and a waterfall in one view.
Find the lever
Golden walks the change down your hierarchy (country, region, segment) and tells you where to start. In one example, Corporate carries 60% of the move while trending worse than the other segments. Start there.
Look ahead, honestly
Hit Forecast and Golden fits exponential smoothing with damped trend and seasonality, picking the model your data supports. With fewer than 8 points it won't forecast at all. The bands are backtested against your own history and widen when the model has been wrong before.
What you get
- 01Granularity from year down to the second, with no new fields to create
- 02Change vs. prior period, vs. last year, running totals, and moving windows, written for you
- 03Outlier segments flagged with a median-based test that one wild value can't fool
- 04Forecast intervals at 80, 90, or 95%
Make the questions cheap
Analysts could always answer these. Each answer just cost half a day, so most never got asked. A PM wondering whether last week's dip is seasonal should be able to click and find out, then ask the next question.
Ask your trend line why
Sign up for early access and get the story behind your biggest swing.