Every team has a question its data can answer
Why did revenue drop in October? Will we hit the number? Which stores should we close? Golden runs the analysis, shows the calculation, and links each conclusion to the chart behind it.
Find your team
Sales & RevOps
Know who's carrying the number before the Monday meeting
Finance
Close the gap between the number and the why
Marketing
Put next quarter's budget where customers come from
Customer Success & Research
Prove what keeps customers, and hear what the unhappy ones say
Operations
See which stores and SKUs need you before they become problems
People
Know who's leaving, where, and why, before the board pack
The analyses, done for you
Known recipes analysts rebuild by hand every week. Golden runs them with the statistical checks and source calculations visible.
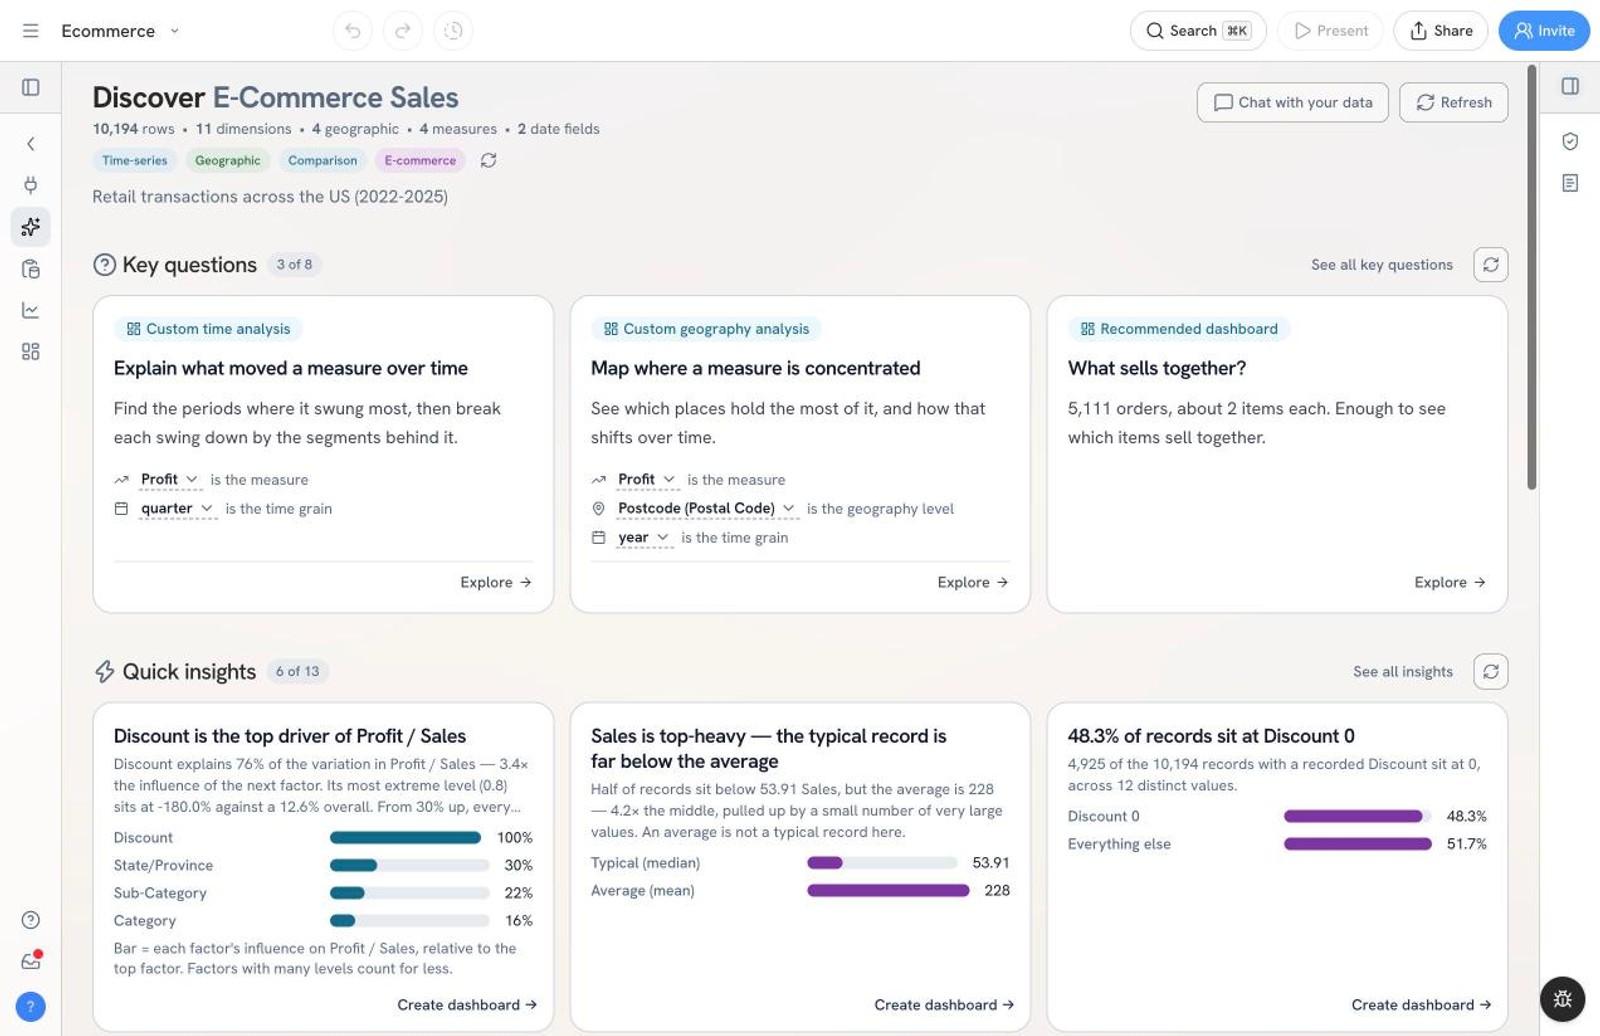
Automated Discovery
Ranked findings from any dataset, with the numbers behind them
Location Analytics
Where it's concentrated, growing, and beating its neighbors
Time Series Analytics
What changed, why, and what's next
Survey Analytics
From raw responses to the gaps that matter
Market Basket Analysis
What sells together, and what's coincidence
Key Driver Analysis
Which lever actually moved the number
Real questions, answered start to finish
A person, a deadline, a question. Here's how each one gets answered in Golden.
Sales Performance Dashboard
Regions, product lines, and reps on one screen
Explain a Revenue Drop
Find where a revenue drop came from, and why
Forecast to Target
Forecast the rest of the year and the odds of hitting plan
Marketing Funnel & Attribution
Price every funnel stage by channel: CPC, CAC, and ROAS
Customer Cohort Retention
Prove whether a change made customers stay longer
Survey & Text Analytics
NPS, weak questions, and what detractors actually say
Store Performance Map
Map every store's sales per square foot and find the weak spots
HR Attrition & Headcount
Find where attrition spiked, why people left, and bridge headcount
Budget vs Actual
Trace a P&L miss to the one account and month that caused it
Multi-Table Modeling
Join a five-sheet workbook without double-counting a thing
SaaS MRR & Churn
MRR movements, net revenue retention, and logo vs revenue churn
Supply Chain Inventory
Trace stockouts to a late supplier and find overstocked categories
Make the questions cheap
Analysts could always answer these. Each answer just cost half a day, so most never got asked. When the first answer is free, people ask the second question, and the third, and that's usually where the good stuff lives.
Bring your hardest question
Sign up for early access and point Golden at the data behind it.