Know which lever actually moved the number
Key driver analysis identifies which dimensions explain a change in a metric. Golden measures each contribution and checks whether the leading relationship still holds after accounting for competing factors.
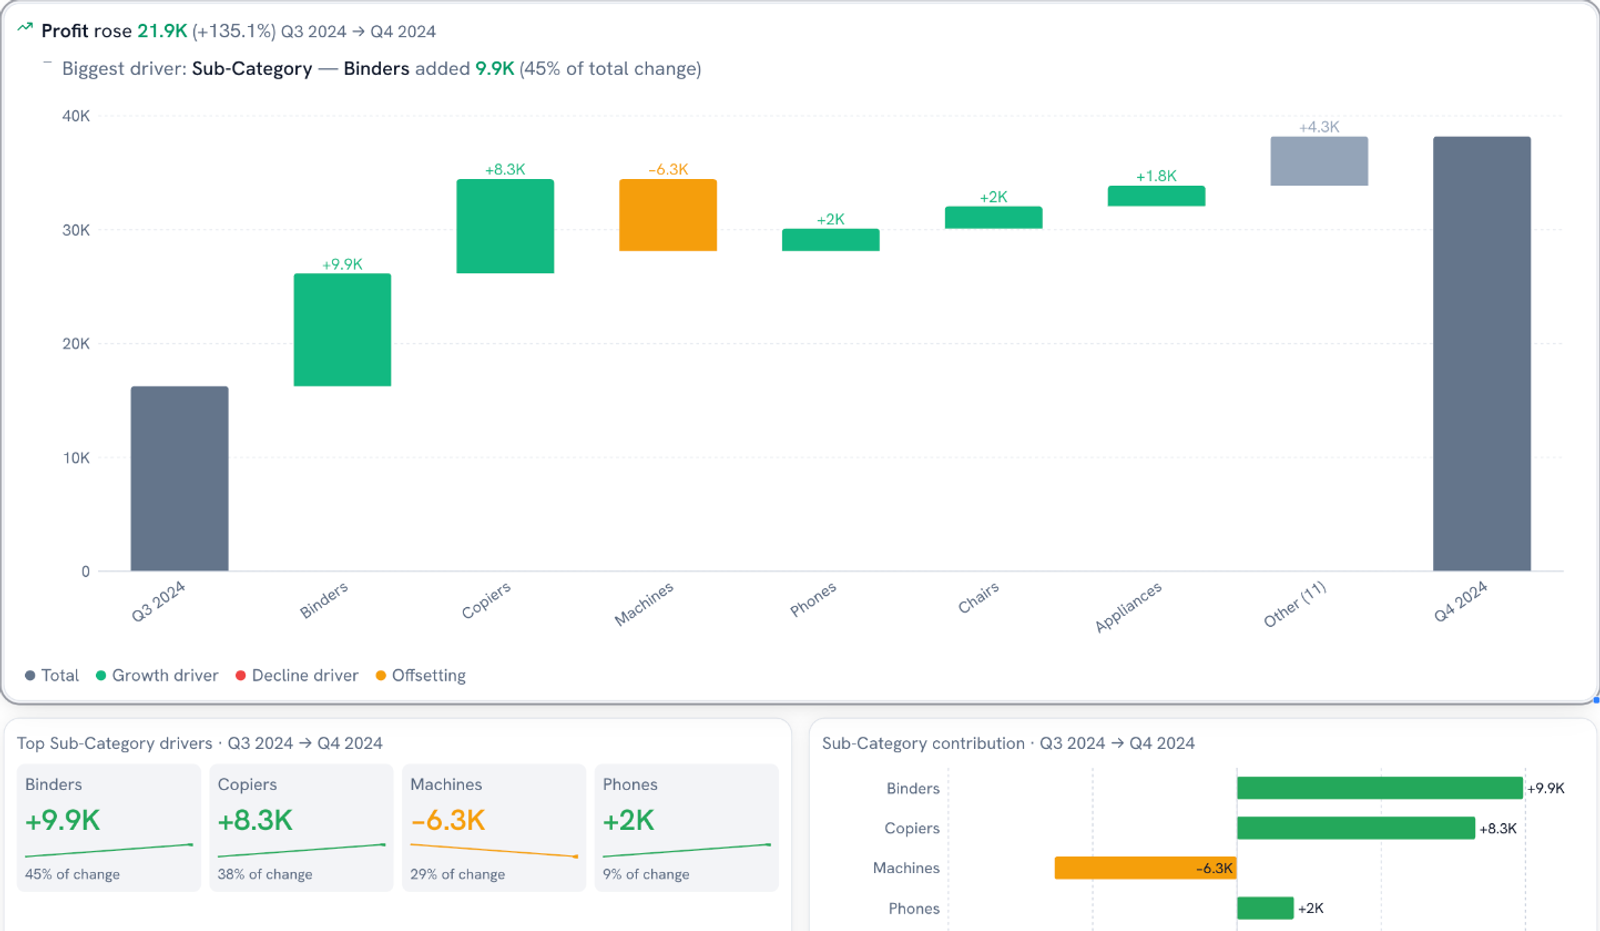
Profit's up 22K. The meeting is at 10.
You slice by category, then region, then segment, then category and region together. Two hours later you have a story.
And you're still not sure whether discount drives margin, or whether the discounted stuff all happens to sell through one channel. Get that wrong and a team spends a quarter fixing the thing that wasn't broken.
Drivers you can defend in the meeting
Golden breaks the change into exact contributions, ranks every dimension by how much it explains, and then stress-tests the winner by holding the runner-up fixed.
You walk into the 10am with the walk from last quarter to this one, the lever that moved it, and a clear note on anything that only looks like a driver.
How it works
Pick the change
Start from any chart, a Quick insight, or the What changed board. Pick the two periods you care about.
See the walk
A waterfall stacks each contribution from the starting value to the ending one, colored as growth, decline, or offsetting. The story reads left to right: Binders +9.9K, Copiers +8.3K, Machines -6.3K.
Rank the drivers
Golden ranks every dimension by how much of the variation it explains (eta squared, if you like names) and leads with the strongest one.
Check for confounders
Then it holds the runner-up fixed and measures the leader again. If the effect mostly disappears, Golden says so: "Product Format looks like the top driver of Profit / Sales, but it is largely explained by Sales Channel: holding Sales Channel fixed leaves only 22.0% of its effect."
Split mix from rate
For ratios like margin or conversion, Golden separates a change in mix (selling more of the low-margin stuff) from a change in rate (the same stuff earning less). The two add up exactly to the total move.
What you get
- 01Driver headlines written straight from the numbers, with no AI in the loop
- 02Drivers that recompute live as you filter the dashboard
- 03Every member labeled: driving growth, driving decline, offsetting, or neutral
- 04Plain framing: a ranking describes your data, and Golden says when it can't prove a cause
The wrong driver is expensive
A confident answer pointing at the wrong lever sends people to work on the wrong thing. Golden's job is to name the right one and show you exactly why it thinks so.
Find your real drivers
Sign up for early access and see what's really behind your last big swing.