Your time analysis shouldn't start with a formula
Golden brings date preparation, period comparisons, moving averages, change analysis, and forecasting into one workflow, with AI assistance and 27 date functions for precise control.
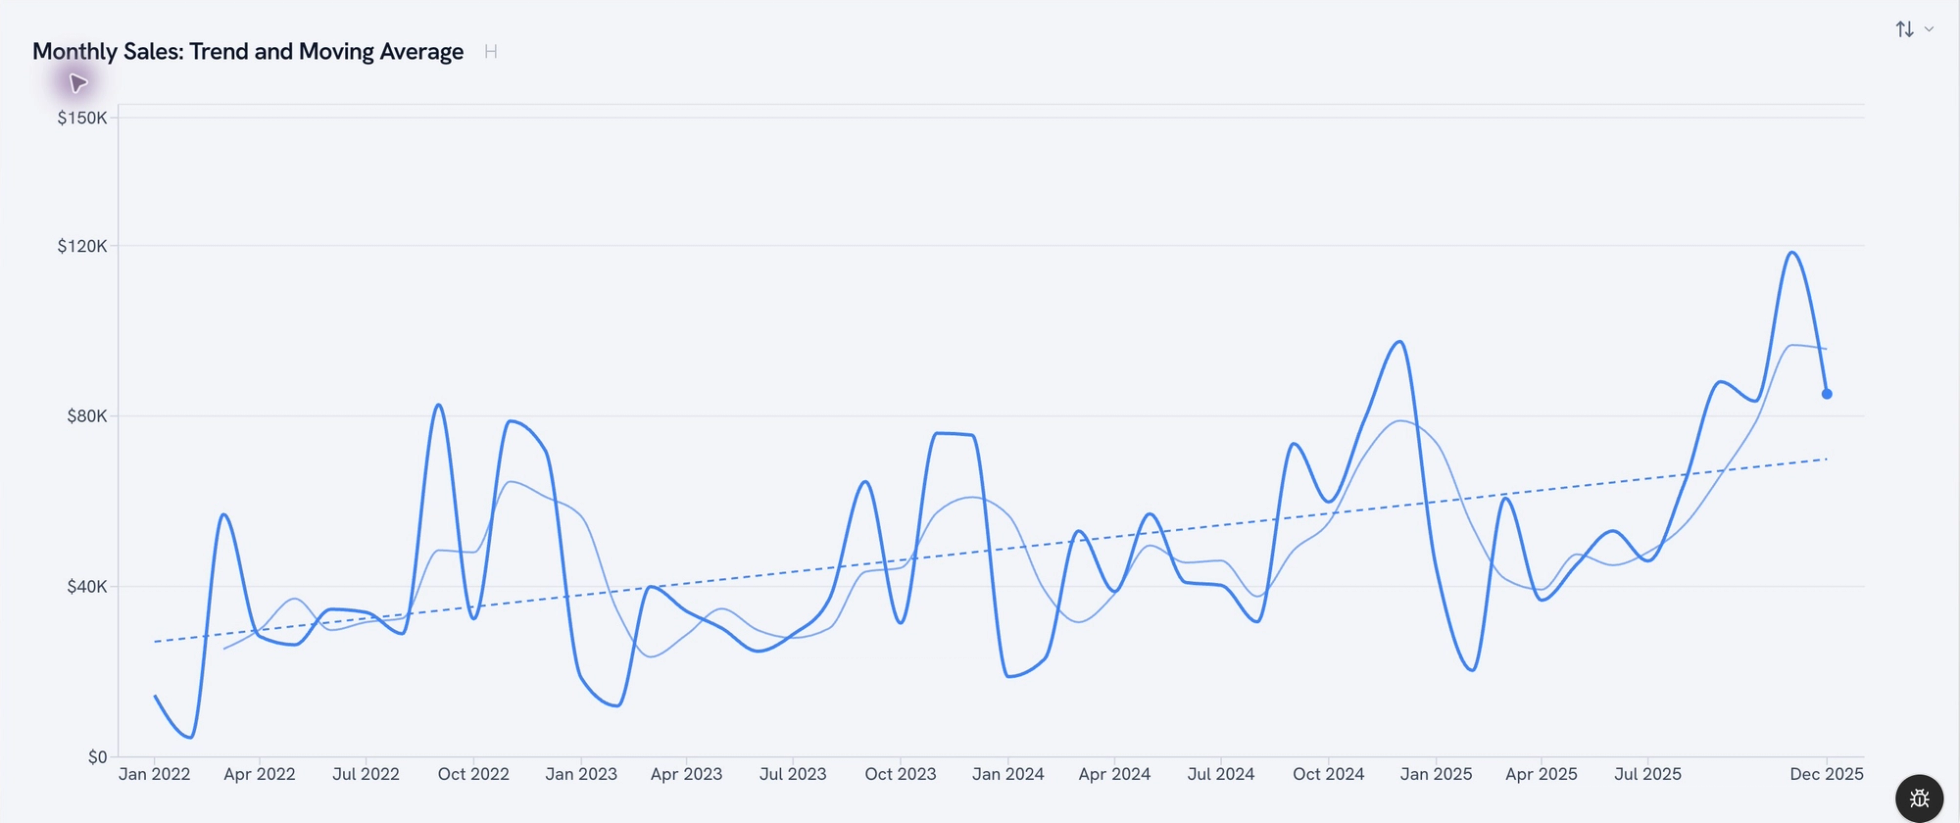
Golden simplifies date and time analysis by recognizing supported date formats, applying period comparisons, and connecting change analysis with forecasting. AI helps turn questions into analysis actions, while visual controls and 27 date functions give analysts precise control.
“Show me revenue growth compared with the same quarter last year.”
It's a reasonable request. Depending on your starting point, answering it can involve cleaning date columns, choosing a date field, defining comparison periods, configuring a calculation, and building a chart.
Then comes the follow-up: “What drove the change?” That can send you back through the data by region, product, and channel.
We're building Golden to take more of that setup and investigation off the analyst's plate. AI helps turn the request into actions on the analysis. Date handling, query calculations, and statistical engines do the computation.
Our recent date and time improvements make that connection more useful. Here's the work we're removing.
From cleaning dates to using them
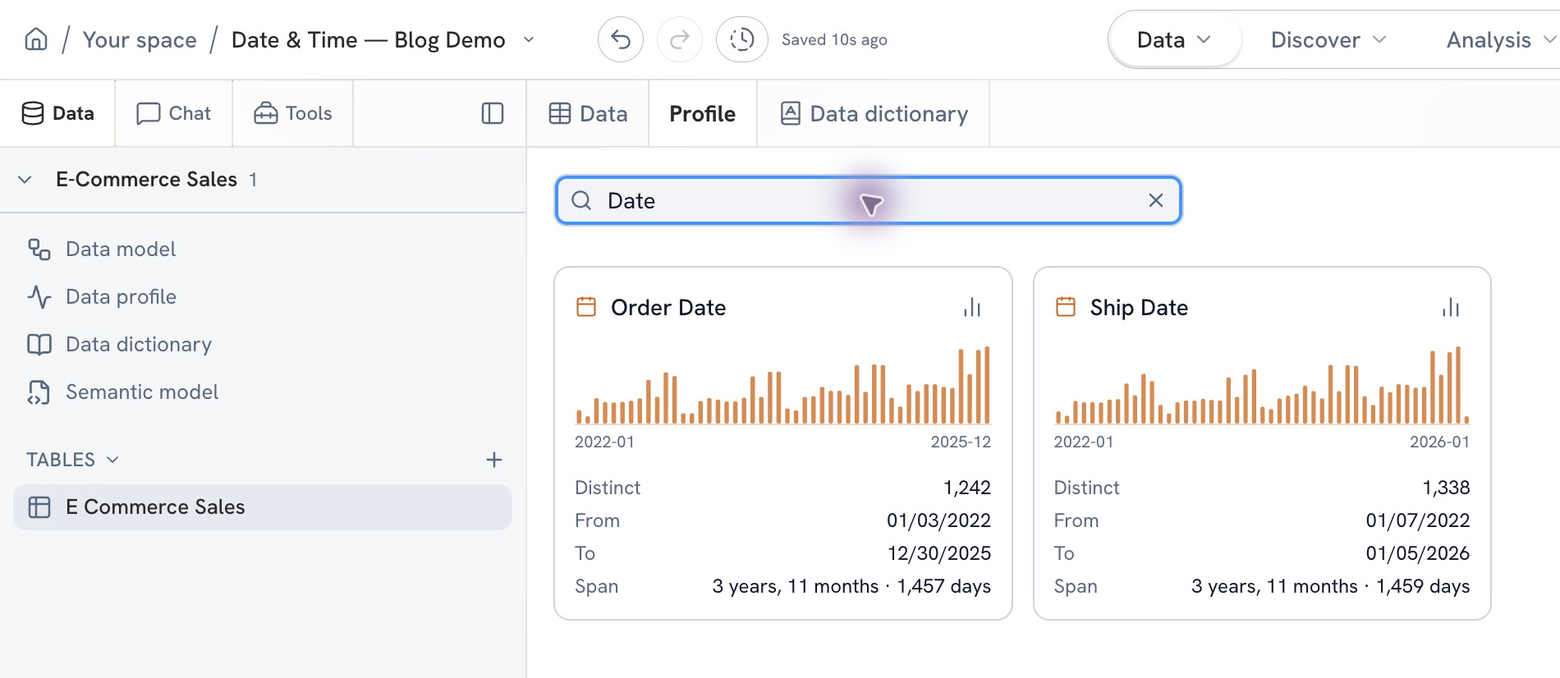
Dates arrive as timestamps, spreadsheet strings, numeric encodings, and labels like Q3 2026. Preparing those values can become a project before the analysis begins.
Golden recognizes supported date formats and connects that recognition to the parsing rules used by its query engine. It also understands text quarter labels for period calculations.
That means an analyst working with a quarterly planning export can apply a year-over-year comparison directly to supported quarter labels. Creating a separate date column solely to make that comparison work becomes unnecessary.
This is foundational product automation. It gives AI and visual controls usable date information to work with. Ambiguous values such as 04/05/26 still need context.
From configuring calculations to asking for the comparison
A request like “show year-over-year growth” contains several instructions: identify the measure, use the relevant date, establish the comparison, calculate the change, and show it in the analysis.
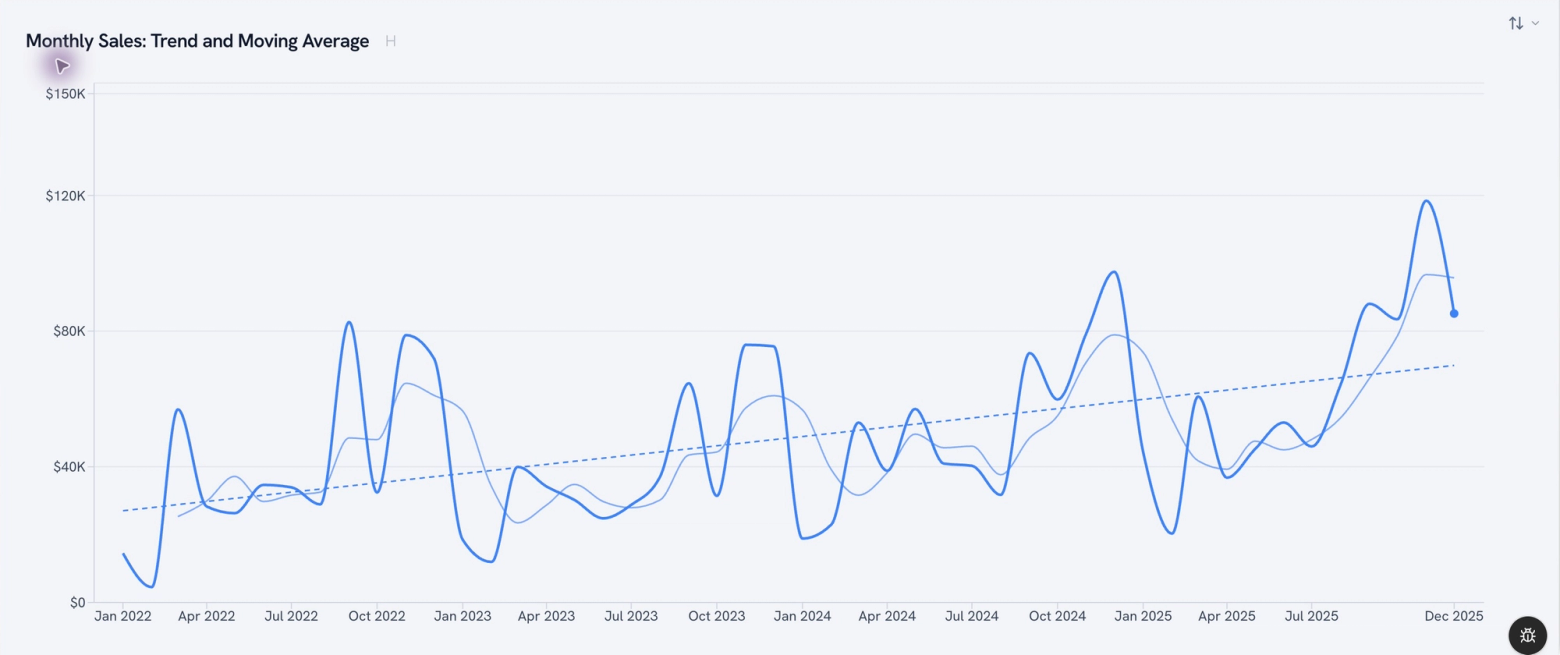
Golden's AI can apply period calculations to the chart you're working on. It can also apply running totals and moving averages, with the calculation settings represented in the chart so you can inspect and change them.
The work saved is translating the question into the tool's calculation setup. You can stay with the business question and refine the result visually.
There are safeguards underneath that interaction. Golden uses the chart's date context and can request clarification when several date fields are plausible. On a recognized quarter axis, a year-over-year comparison matches the same quarter a year earlier. If that quarter is missing, the comparison stays blank.
An AI request is useful when the analysis it creates has the meaning you intended.
From creating helper fields to exploring patterns
To investigate support demand, you might need weekday, hour, and month extracted from a timestamp. Those helper columns are familiar work for analysts.
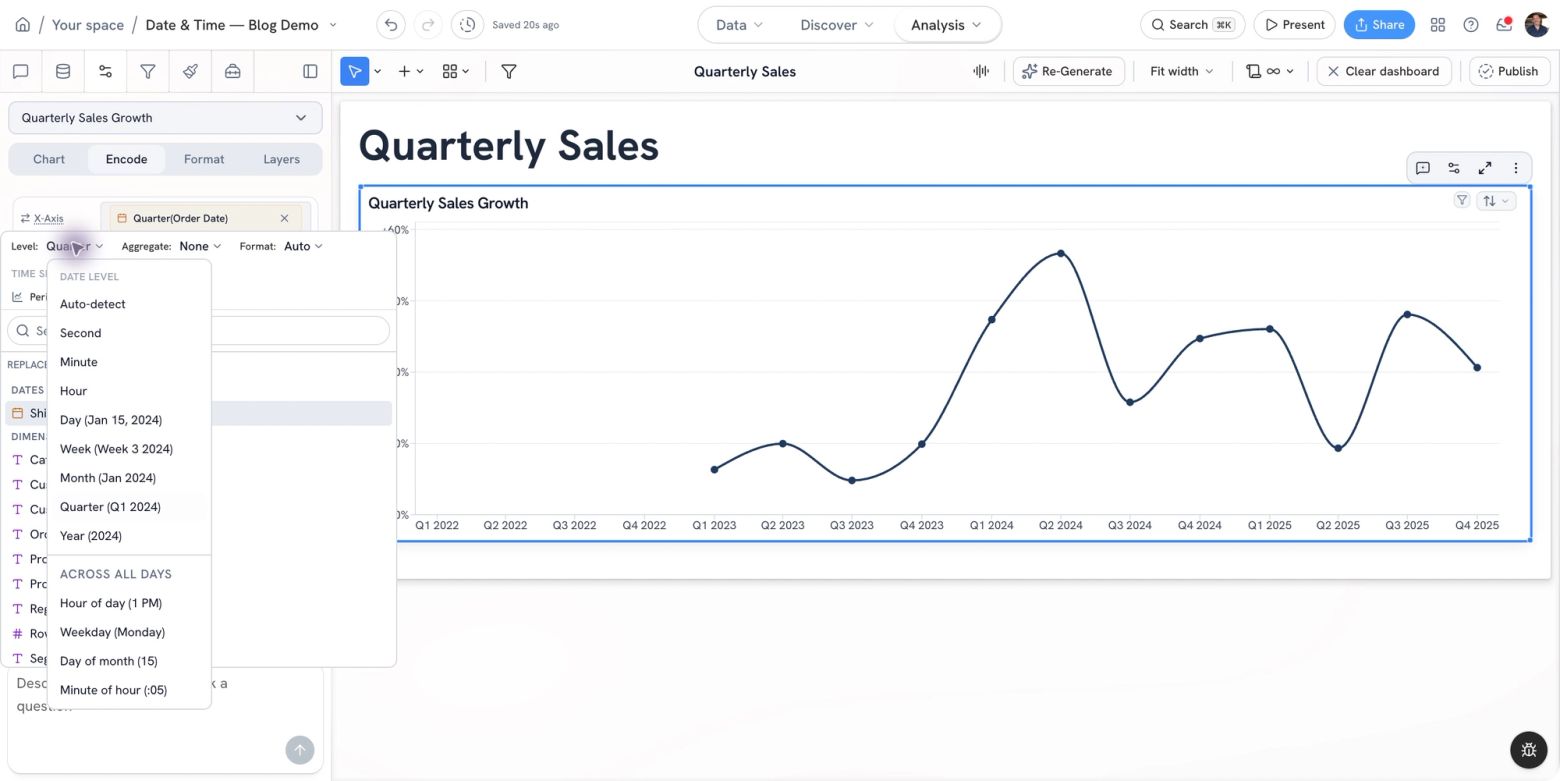
Golden now offers weekday, hour of day, day of month, and minute as date-grouping levels. You can change the level of analysis directly instead of creating a calculated field for each view.
A support leader can explore requests by weekday and hour to inform staffing. A retailer can overlay years to investigate recurring seasonal patterns. The analyst spends more time interpreting the pattern and less time preparing another version of the date.
From rebuilding breakdowns to investigating the change
Finding a revenue decline is usually the beginning of the work. Understanding it can mean rebuilding the comparison by region, then product, then another business dimension.
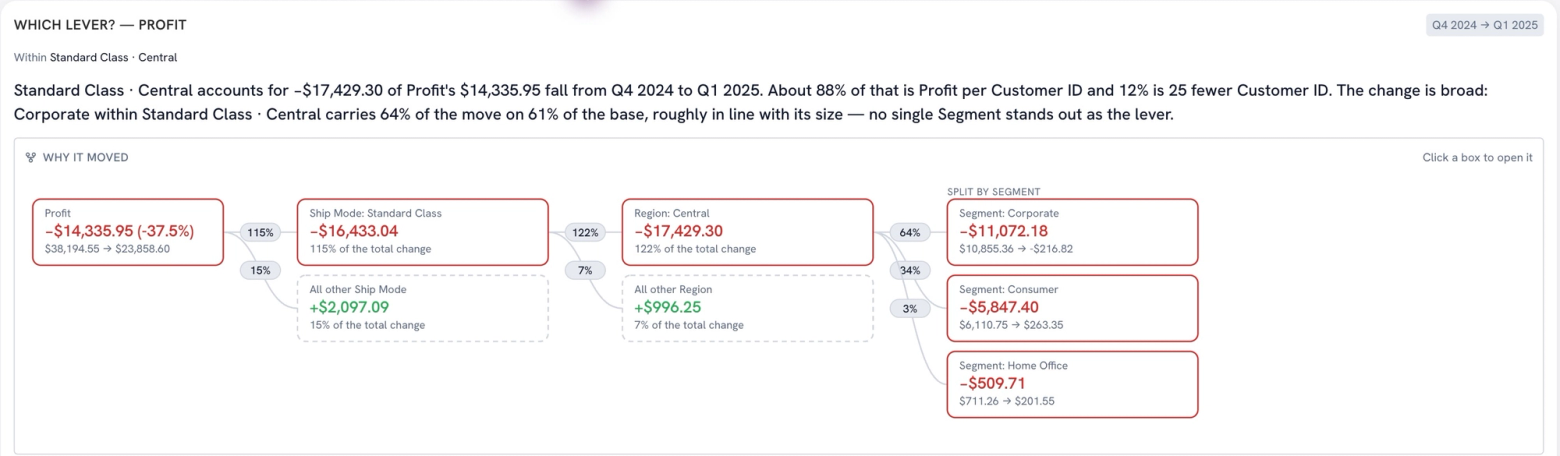
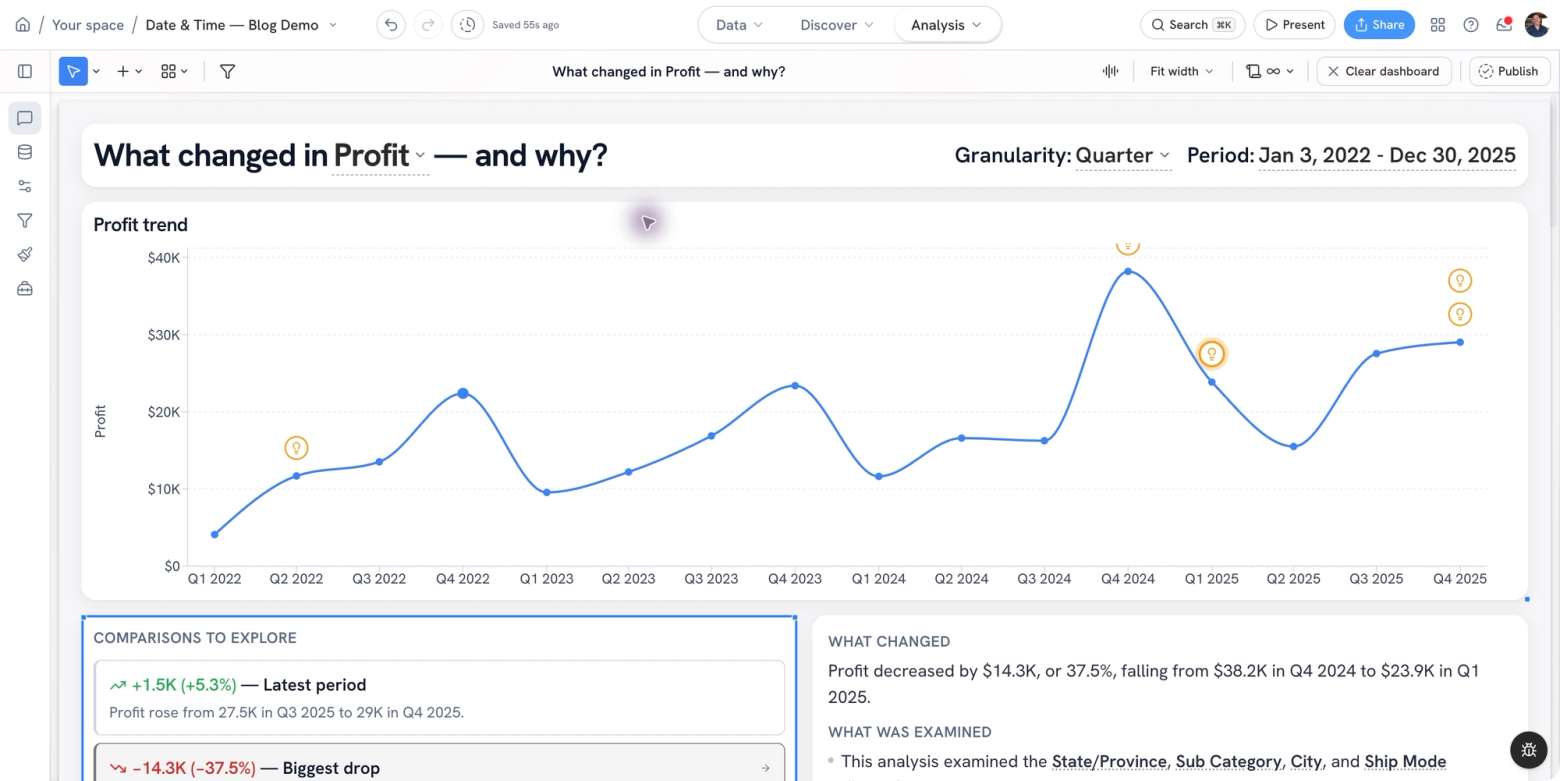
Golden's Explain Change workflow computes period-over-period segment contributions. AI can open that analysis using the active chart's measure, date context, and filters, bringing the breakdown into the conversation.
In our published sample-data walkthrough, a quarterly profit decline can be explored through state contributions and a more specific business segment.
This automates part of the investigation an analyst would otherwise assemble across several views. The result gives you contributors to examine; establishing the underlying business cause still requires judgment.
From assembling a forecast to evaluating what's ahead
Looking ahead introduces another set of tasks: prepare the time series, choose a model, check the history, assess uncertainty, and compare the projection with a target.
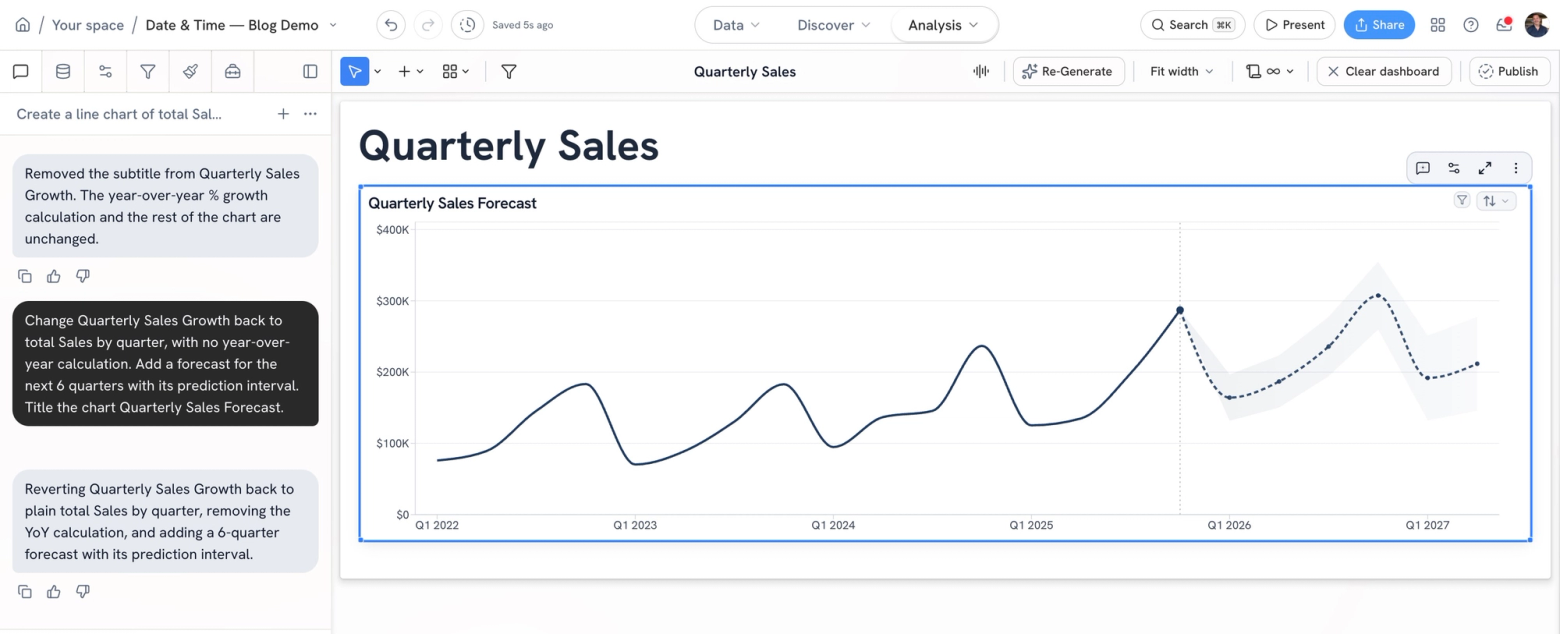
Golden's AI can configure a forecast on a date-based chart. The forecasting engine handles model evaluation, backtesting, and prediction intervals. Target assessment combines observed performance with the forecast for the remaining periods.
The engine requires at least 8 complete periods before producing a forecast. Model choice also depends on the history available, including whether there's enough evidence for seasonality.
That gives the analyst a starting point for discussing progress and risk without assembling a forecasting workflow from scratch.
Keep precise control with 27 date functions
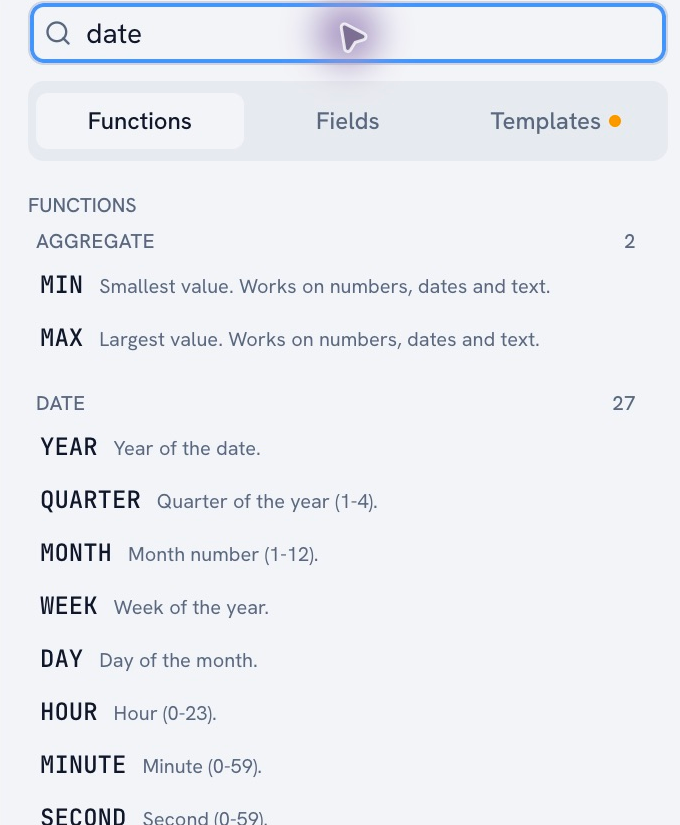
Analysts also need to express the exact rule the business uses. Golden includes 27 date functions for that work, available directly in calculated fields.
You can extract a year, quarter, weekday name, or hour; move a date forward; align timestamps to the start of a reporting period; construct dates from separate columns; and control how dates are parsed and displayed.
For example:
- Group signups by calendar month:
DATETRUNC("month", [Signup Date]) - Set a deadline 3 weekdays after an order:
WORKDAY([Order Date], 3) - Count weekdays between order and shipment:
BUSINESSDAYS([Order Date], [Ship Date]) - Read UTC events in Los Angeles local time:
CONVERT_TZ([Event Time], "UTC", "America/Los_Angeles") - Combine separate date and time columns:
MAKEDATETIME([Order Date], [Order Time])
The weekday functions skip weekends; holiday calendars require additional logic. Time-zone conversion follows daylight saving, so you can use a named zone instead of maintaining a fixed-hour offset.
Give elapsed time its own treatment
Duration is a good example of where a built-in capability removes fiddly work.
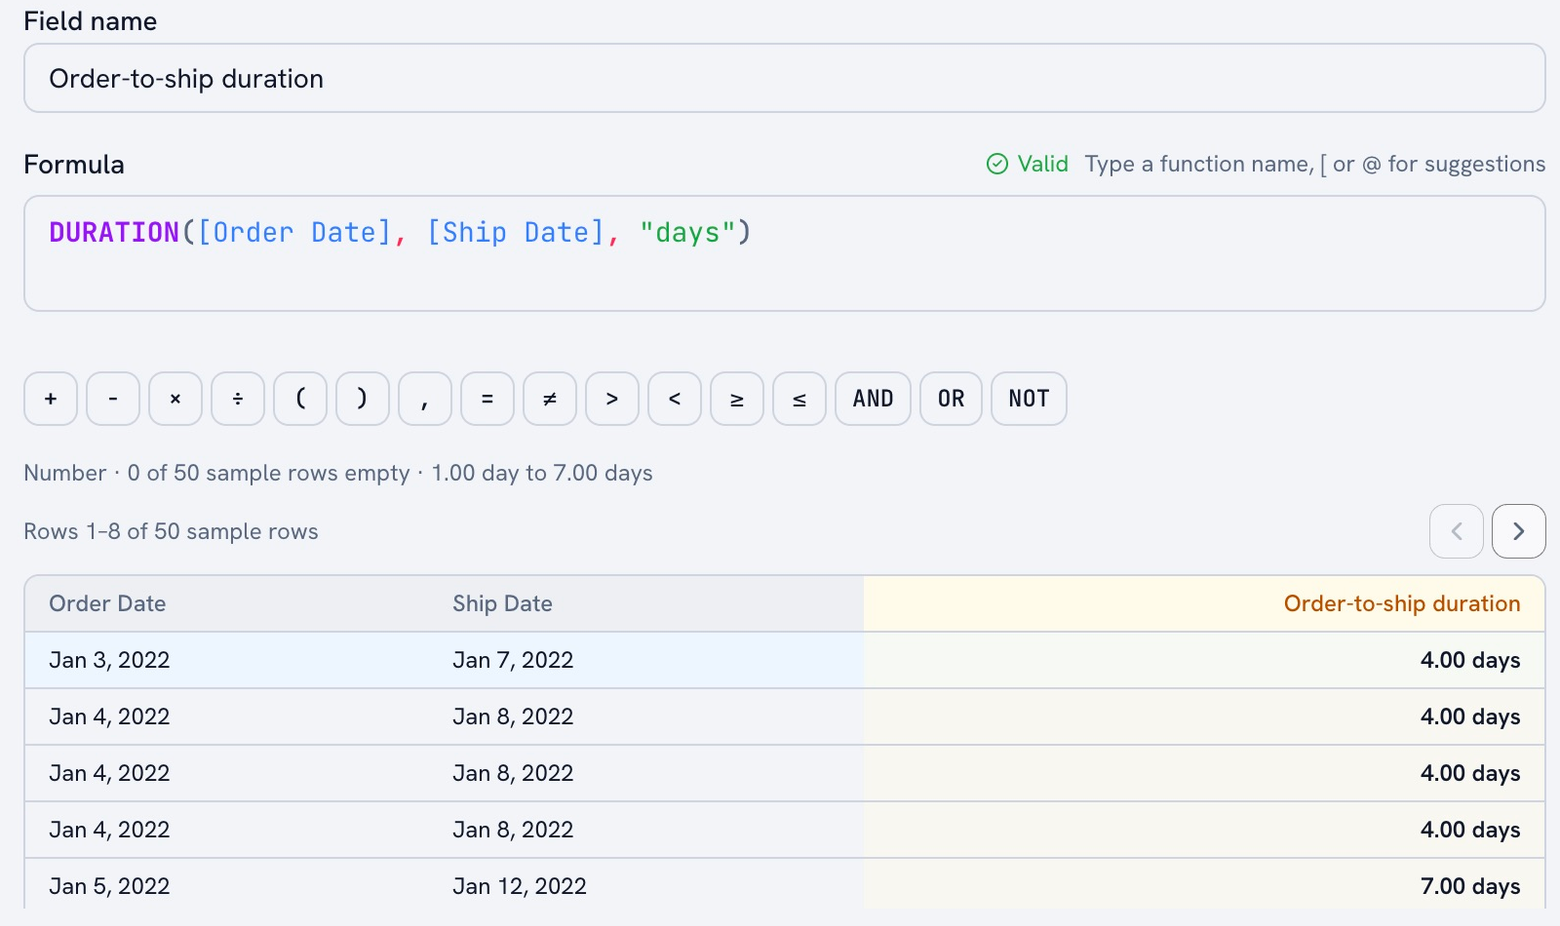
An order placed at 11:59 p.m. and shipped at 12:01 a.m. crosses a day boundary. Only 2 minutes have elapsed. Counting date boundaries and measuring elapsed time answer different questions.
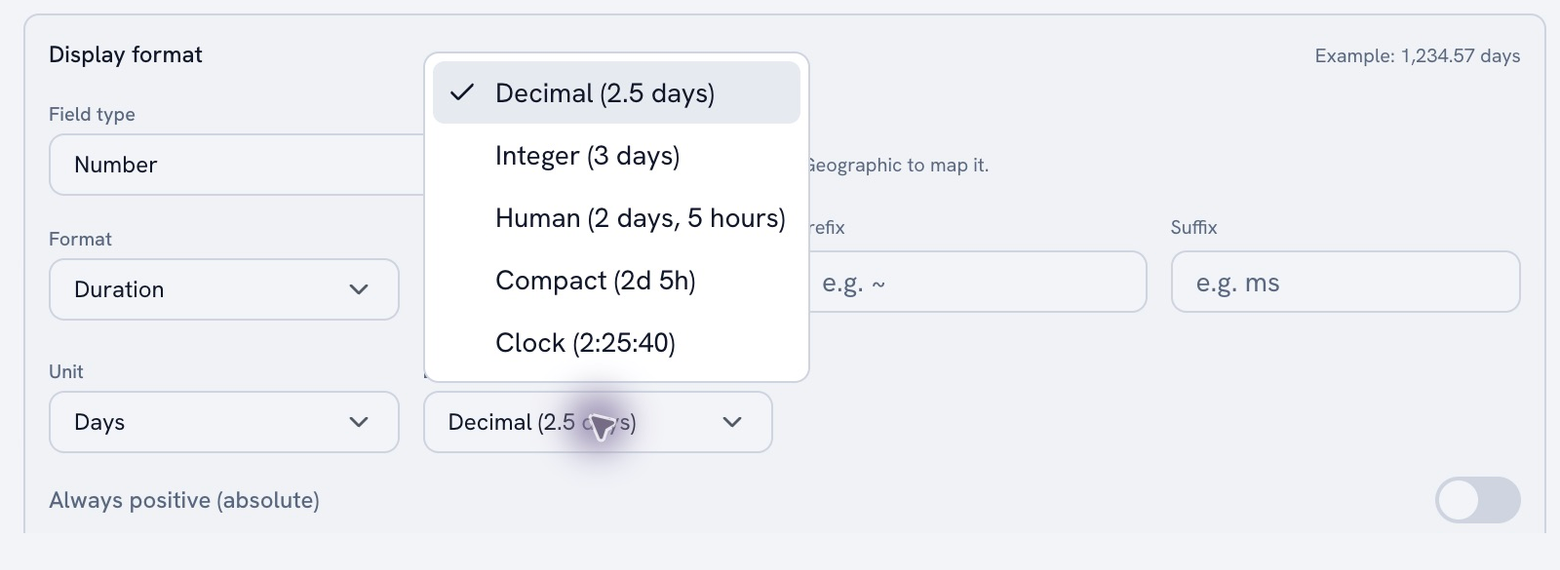
Golden supports both DATEDIFF and DURATION. You can write DURATION([Order Date], [Ship Date], "minutes") and use duration formatting to present elapsed time in human-readable, compact, or clock form. An elapsed clock display can show 25:30:00 for 25 hours and 30 minutes, carrying the full duration beyond 24 hours.
That saves the analyst from assembling hours, minutes, and seconds into a custom display calculation for fulfillment times, support resolution, or processing delays.
Tableau supports elapsed-time calculations through DATEDIFF, but its documented date-function catalog has no equivalent built-in DURATION function. Golden combines a dedicated duration function with duration formatting, reducing the custom calculation and display work needed for this use case.
AI can help generate a calculated field, and the analyst can write or edit the formula directly. The business rule stays explicit and reviewable.
AI connects the steps
These capabilities work at different levels. Date recognition and built-in grouping automate preparation. Query calculations compute comparisons. Statistical models produce forecasts. AI helps the user select and apply those capabilities through the question they're asking.
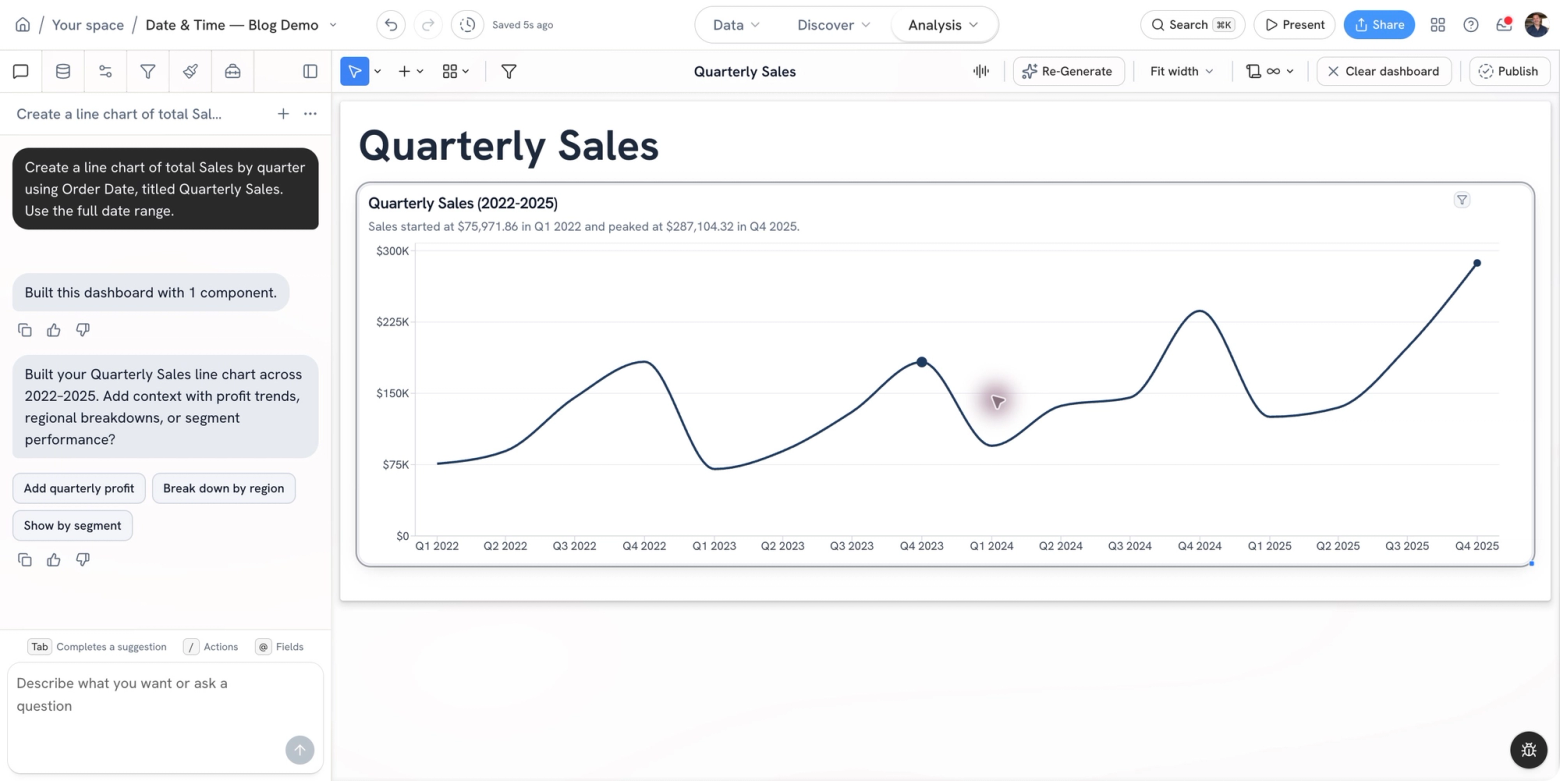
In the accompanying sample-data demonstration, AI built a quarterly sales chart, changed it to year-over-year percentage growth, and then added a 6-quarter forecast after returning to sales totals. The chart and calculation controls remained available for inspection.
The value is being able to continue the analysis without translating every follow-up into another sequence of setup tasks.
Where Golden aims to differentiate
Tableau already offers quick calculations. Power BI has time-intelligence tools and calendar modeling. Hex supports visual time grouping and calculations. Sigma provides guided period comparisons.
Golden's approach brings date preparation, conversational chart changes, computed change analysis, and forecasting into a connected workflow. You can ask for an analysis, inspect it, adjust it visually, and keep investigating.
That's the experience to evaluate. Bring a real date column, ask for a comparison, investigate a change, and look ahead. Check how much setup the product handles, how clearly it exposes its assumptions, and how easily you can ask the next question.
Frequently asked questions about date and time analysis
What is date and time analysis?
Date and time analysis examines how a measure changes across periods, how recurring patterns behave, and how long events take. Common examples include year-over-year growth, moving averages, customer retention, order-to-ship duration, and forecasts.
How does Golden use AI for time analysis?
Golden’s AI can create date-based charts, apply period comparisons and moving averages, and configure forecasts. It can also open Explain Change using the active chart’s context. Query and statistical engines compute the results; analysts can inspect and edit the settings.
What is the difference between DATEDIFF and DURATION?
DATEDIFF counts boundaries of a chosen date unit. DURATION measures elapsed time between two dates. From 11:59 p.m. to 12:01 a.m. the next day, one day boundary is crossed but only two minutes have elapsed. Golden also provides duration display formats.
Can analysts write their own date calculations in Golden?
Yes. Golden provides 27 date functions in its calculated-field editor. Examples include DATETRUNC, DATEADD, WORKDAY, BUSINESSDAYS, CONVERT_TZ, and DURATION. Analysts can write formulas directly or use AI assistance, then review the calculation and preview its results.
How much history does Golden need for forecasting?
Golden’s forecasting engine requires at least 8 complete periods. It evaluates models and backtests predictions, with prediction intervals to show uncertainty. Seasonal models require enough history and evidence of a recurring pattern; 8 periods alone do not guarantee seasonal forecasting.
Explore Golden’s analytics workspace and time-series analysis to see these workflows in action.