From Survey Responses to Insights in Two Clicks
Golden Analytics turns raw survey and NPS data into interactive dashboards in two clicks—automatically reshaping responses so analysts can start with insights.
If you’ve ever analyzed survey data, you know the hardest part usually isn’t answering the questions.
It’s getting the data into a format you can actually analyze.
Whether the data comes from Qualtrics, SurveyMonkey, Google Forms, Typeform, or another survey platform, the workflow is almost always the same. You export the results, reshape the data, figure out how to visualize it, and build dashboards so stakeholders can explore the results.
Only then can you start looking for insights.
There are experts like Steve Wexler who have spent years teaching the best ways to analyze survey data. His dashboards are some of the best I’ve seen, and every time I see one, I learn something new.
But it got us thinking.
Why should every analyst have to rebuild the same analytical experience?
From Raw Survey Data to Insights
We wanted Golden Analytics to remove the mechanics of survey analysis so analysts can spend more time understanding what respondents are actually telling them.
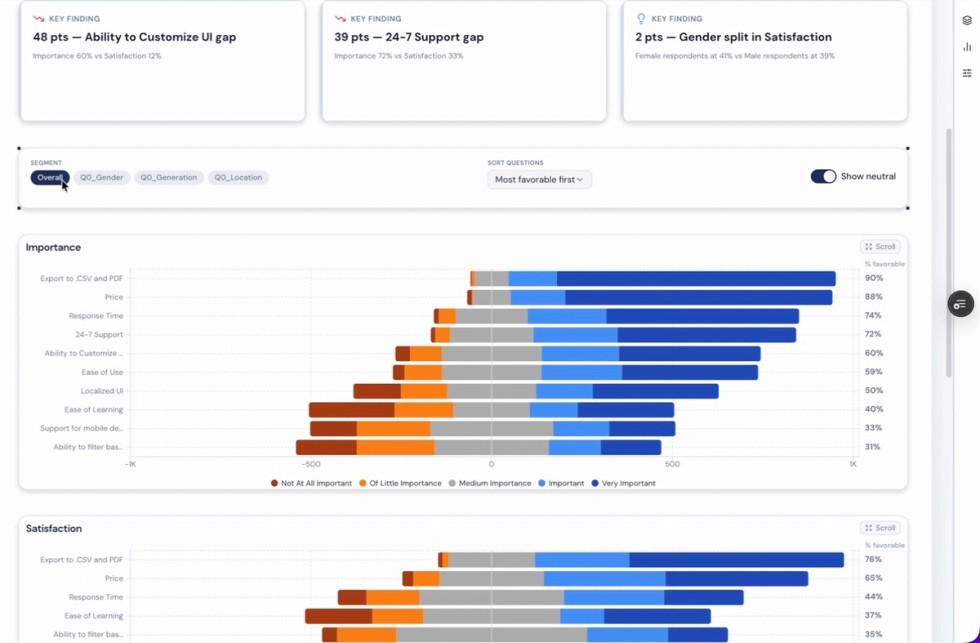
Instead of manually reshaping survey responses and building dashboards from scratch, Golden automatically recognizes survey datasets and creates an analytical experience optimized for survey data.
Simply connect your data.
Golden handles the rest.
See it in action
In just a few clicks, Golden:
- Detects survey datasets automatically
- Reshapes responses for analysis
- Creates purpose-built dashboards and visualizations
- Lets you filter and segment responses instantly
- Makes it easy to explore results without manual preparation
NPS Analytics Without the Setup
Net Promoter Score (NPS) is one of the most common survey methodologies, but analyzing it often requires even more manual work.
Teams typically spend time calculating promoter, passive, and detractor distributions, building scorecards, creating trend charts, and segmenting results by customer, geography, or product.
Golden does that automatically.
It recognizes NPS data, understands the scoring model, and immediately generates dashboards designed for exploring customer sentiment.
Watch the NPS experience
Instead of building dashboards, you can immediately answer questions like:
- Which customer segments have the highest NPS?
- How has our score changed over time?
- Which products or regions are driving detractors?
- What comments are associated with our lowest scores?
- Where should we focus to improve customer satisfaction?
Built for Analysts
We don’t believe AI should replace analysts.
We believe it should remove the repetitive work that keeps analysts from doing what they do best: understanding the business and communicating insights.
Survey analytics is a perfect example.
Less time preparing data.
More time discovering answers.
That’s exactly why we built this.
We’d love to hear what you think—and what other survey workflows you’d like to see automated.