Market Basket Analysis Made Easy
The products customers buy most often aren’t always the ones they choose together. Golden finds the combinations that happen more often than chance and shows which relationships are worth acting on.
If you’ve ever tried to figure out which products customers buy together, you know the obvious answer is often the wrong one.
The most common pair is usually just the two products everybody buys.
That may be useful for a sales report. It does not tell you what to bundle, what to recommend next, or which products have a real relationship.
For that, you need market basket analysis.
From transaction data to real relationships
Market basket analysis asks a simple question: which items appear together more often than chance would predict?
Getting to that answer has traditionally taken a lot of work. Analysts group transaction rows into baskets, generate every possible product pair, calculate association measures, test the results, and then build a view that someone else can understand.
Golden handles that analytical workflow for you.
Connect an order and line-item table, or bring in a file or Google Sheet. Golden evaluates the combinations, separates popularity from genuine connection, and creates an interactive analysis of the relationships that matter.
See it in action
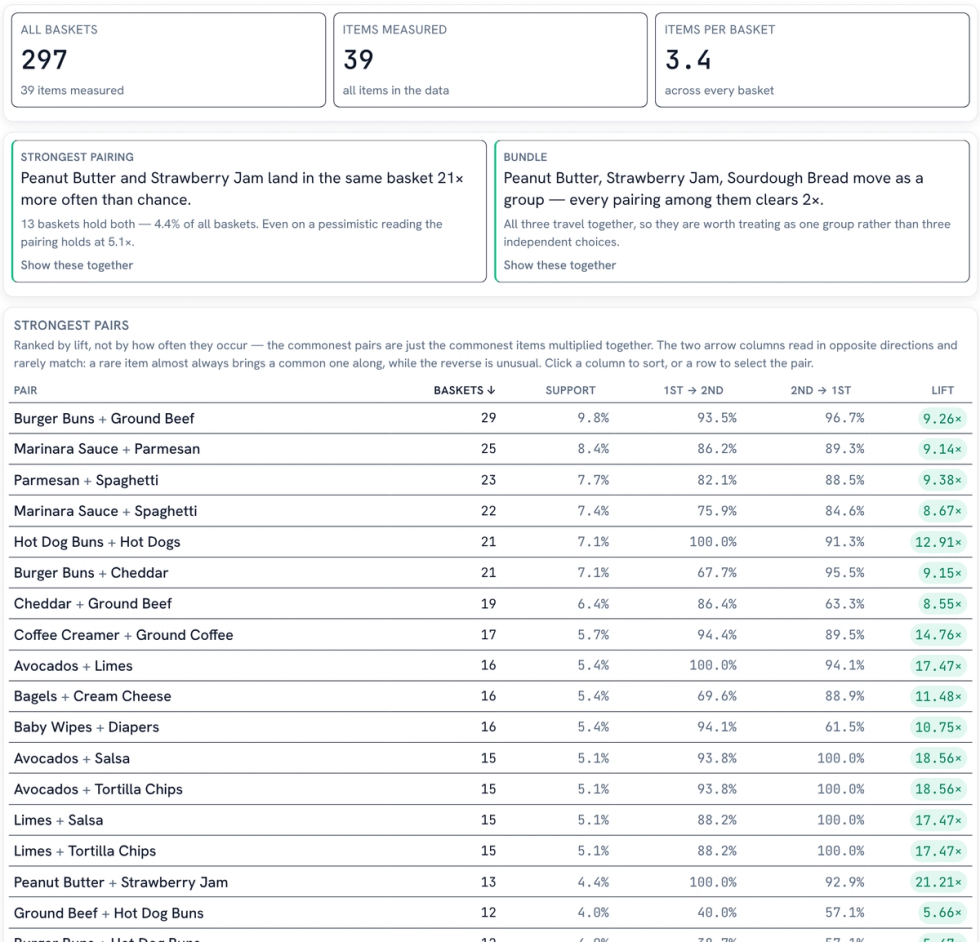
In one grocery dataset, 1,000 transaction lines become 297 baskets containing 39 different items.
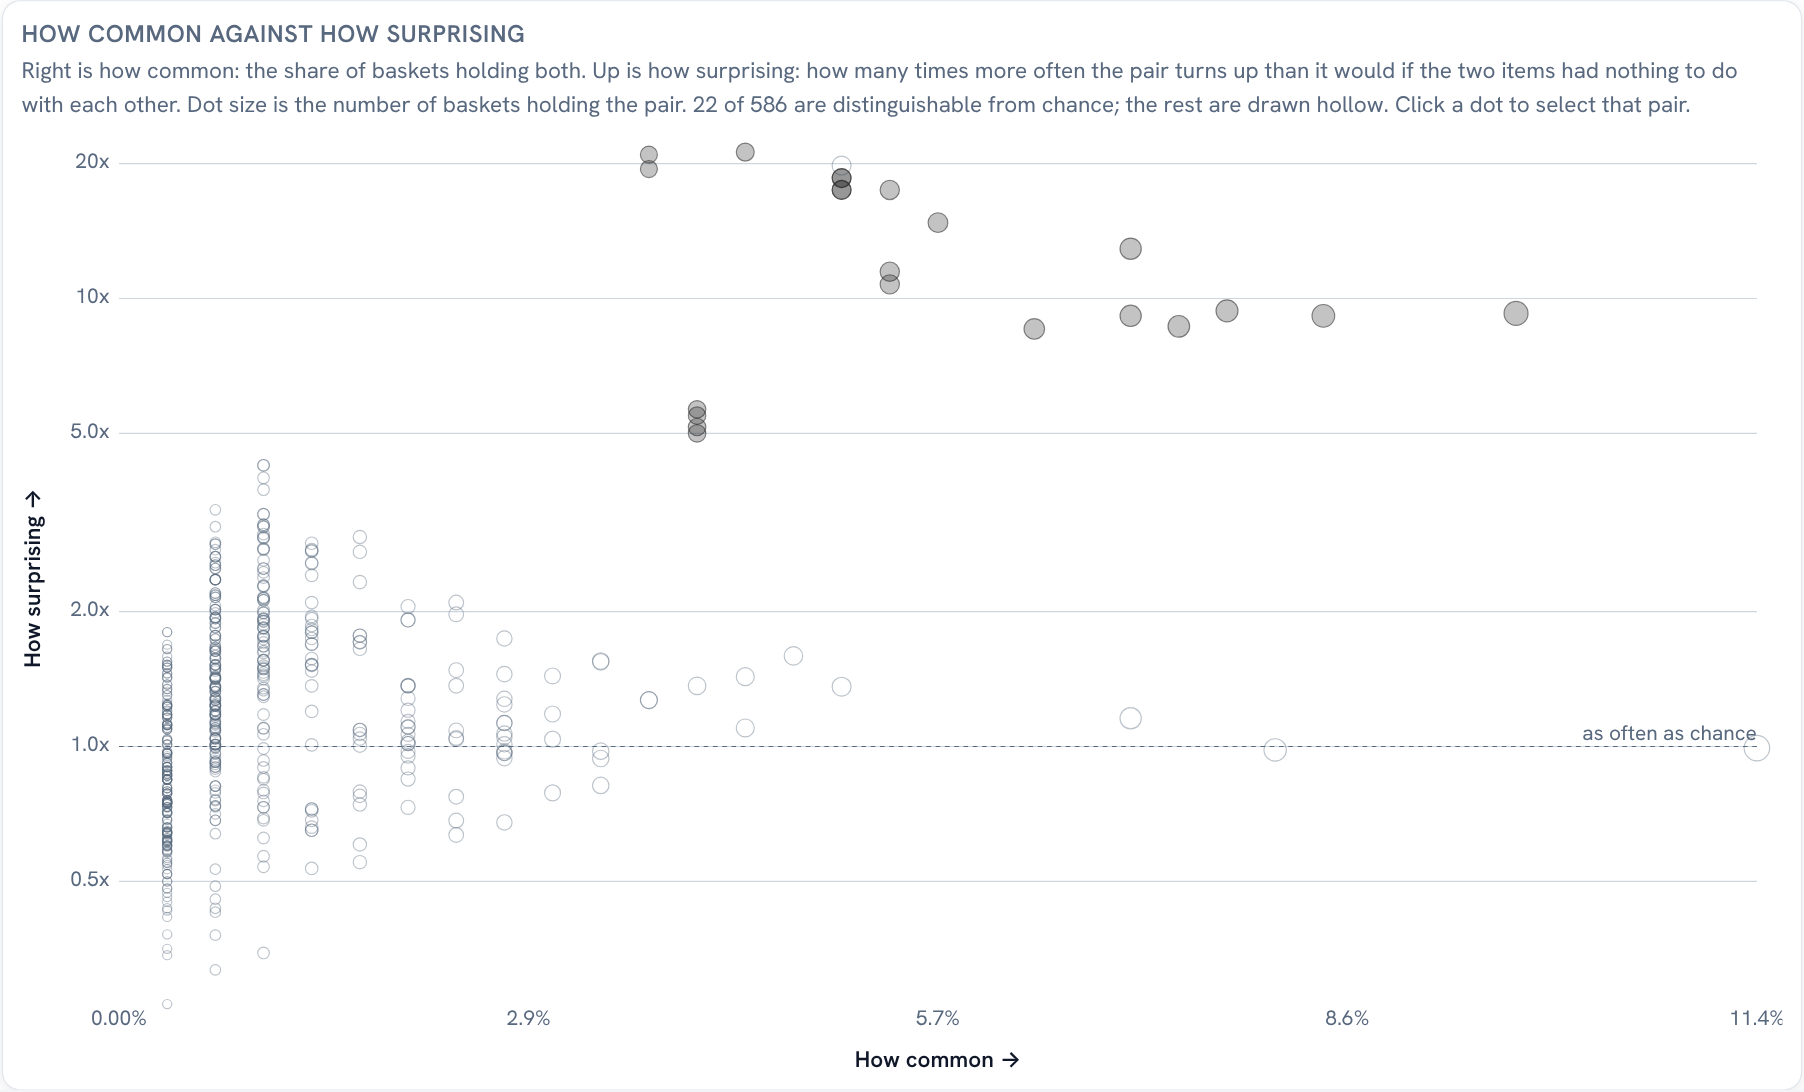
Golden evaluates 586 possible product pairs. Only 22 clear the statistical bar.
That distinction is the point. The goal is not to produce a long list of pairs. It is to find the small number worth acting on.

Popularity is not connection
Imagine bananas appear in 39% of all baskets. Because they are popular, they will show up next to many other products.
A simple co-purchase count may put bananas near the top of the results even when there is no meaningful relationship. Golden corrects for that baseline using lift: how many times more often two products appear together than they would if they were unrelated.
A lift of 1 means the combination happens about as often as chance would suggest. A higher lift points to a stronger relationship.
In the grocery example:
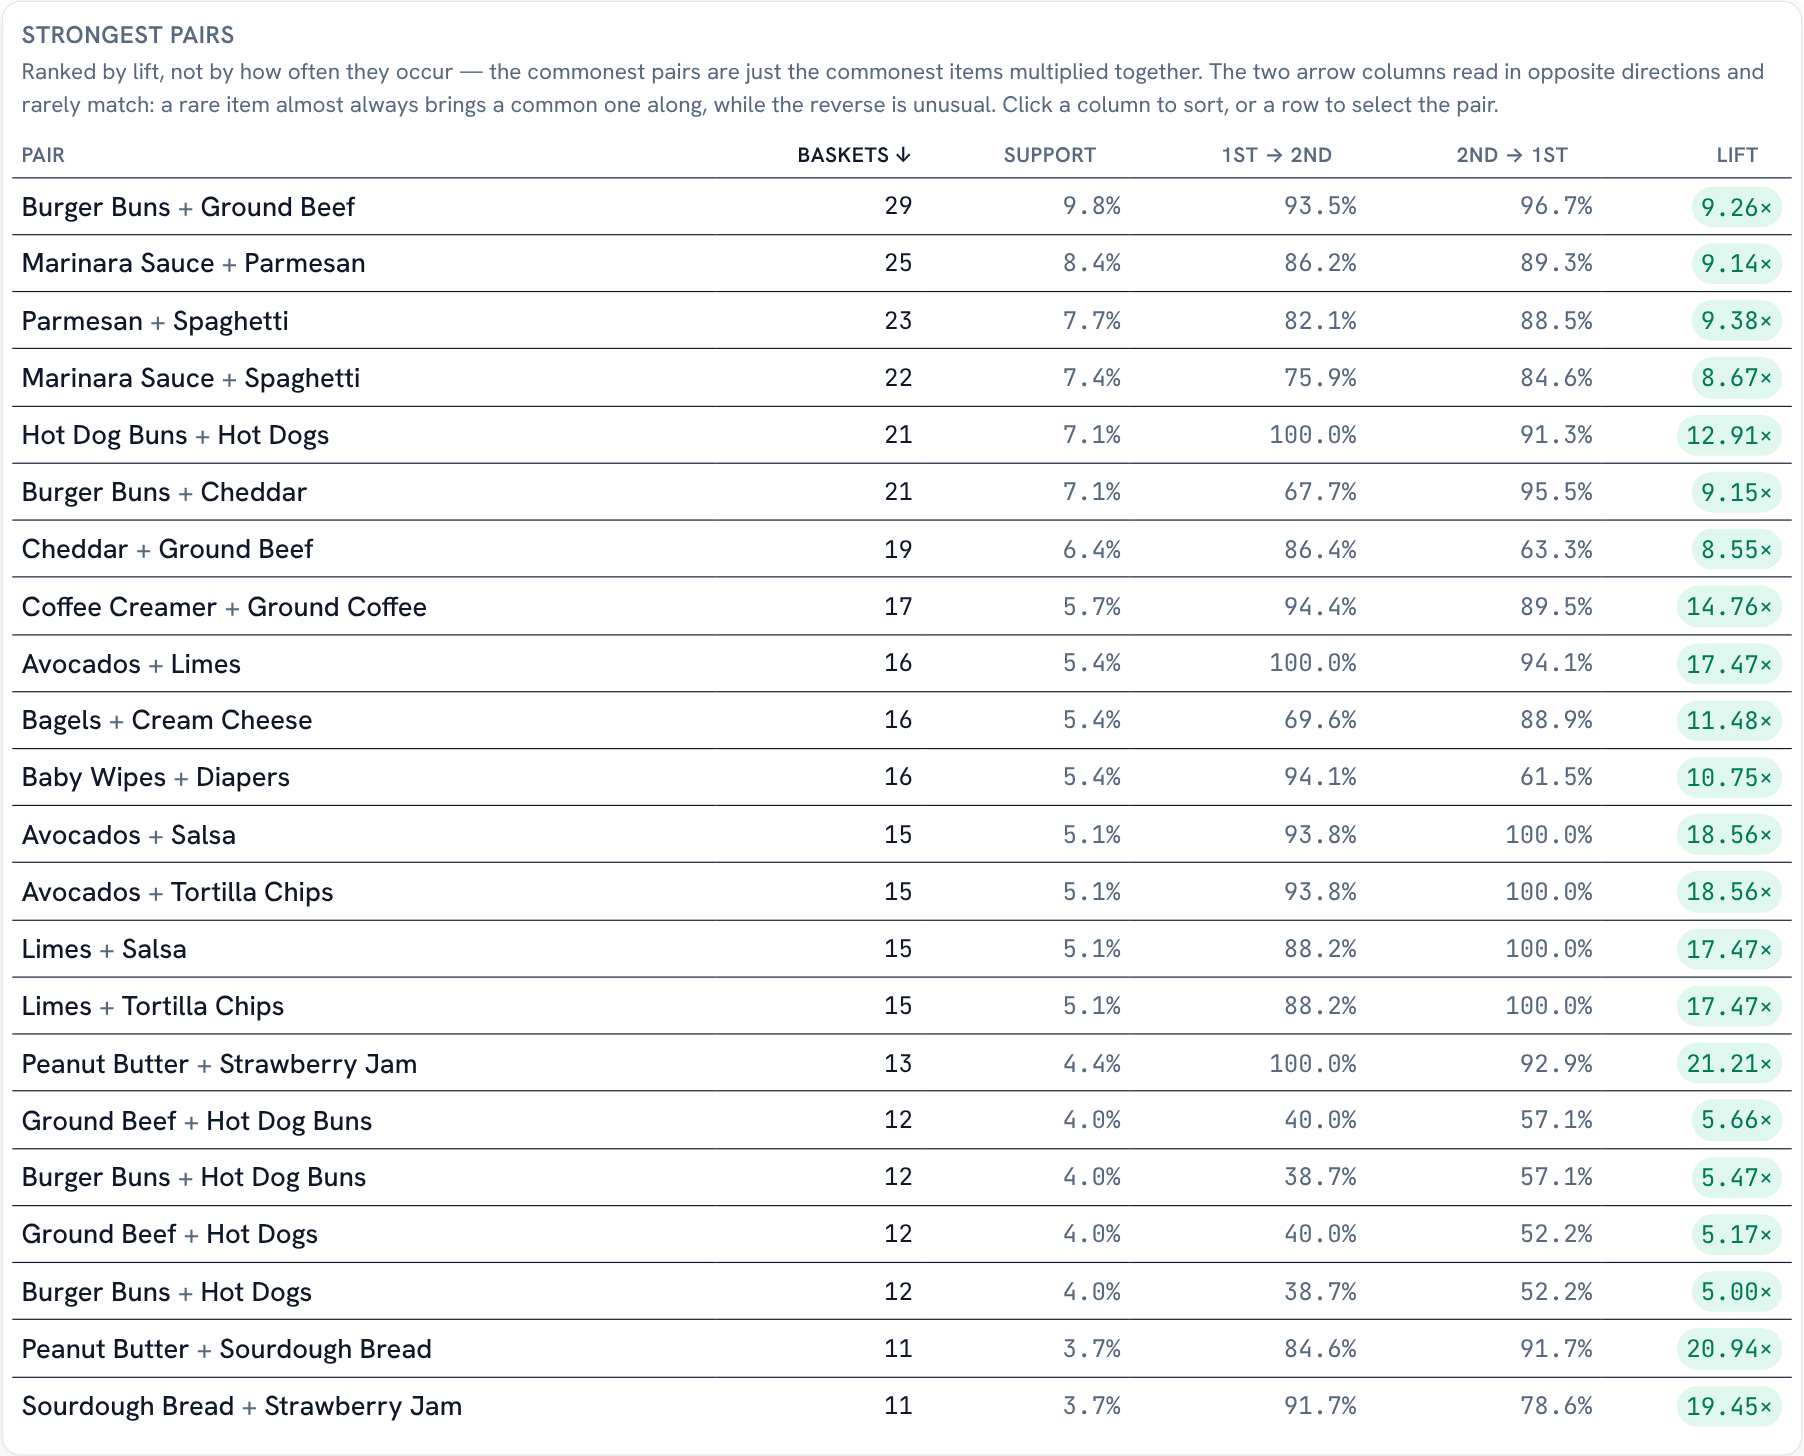
- Burger Buns and Ground Beef appear together in 29 baskets, 9.3 times more often than chance.
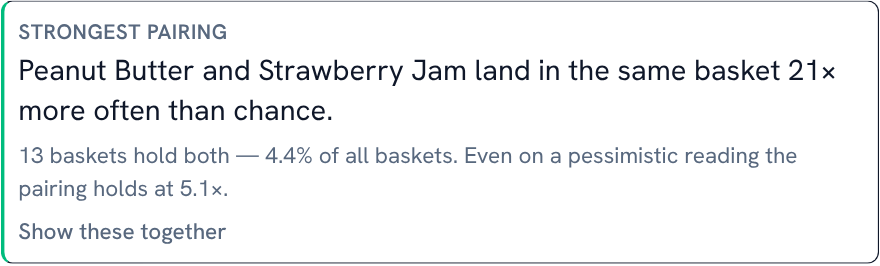
- Peanut Butter and Strawberry Jam appear together in 13 baskets with a lift of 21.
- Bananas are among the most popular items, but they do not appear among the meaningful pairs.
The best-selling product is not automatically the best cross-sell.
The numbers behind the answer
Golden calculates three measures for every pair:
- Support shows how often the two items appear in the same basket.
- Confidence shows how often buying one item leads to the other.
- Lift shows how surprising the combination is compared with chance.
Confidence is directional. People who buy peanut butter may often buy jam, while people who buy jam may not choose peanut butter at the same rate. Golden reports both directions so the recommendation stays honest.
It also tests the relationships statistically. When hundreds of pairs are evaluated, some will look interesting by accident. Golden accounts for that and keeps the combinations with enough evidence behind them. If the data is too thin, it says so.
No result is better than a confident recommendation built on noise.
How Golden makes market basket analysis easy
Market basket analysis usually starts with a long checklist: prepare the transactions, write the pair-generation logic, choose thresholds, calculate the statistics, correct for false discoveries, and design something people can explore.
Golden brings those steps into one analytical experience.
- Work with the data you already have. Use order and line-item tables in Snowflake, Databricks, BigQuery, Redshift, Azure SQL, or Microsoft Fabric, or start with a file or Google Sheet.
- Evaluate every combination. Golden calculates support, lift, and confidence in both directions instead of relying on raw co-purchase counts.
- Separate evidence from noise. Statistical testing and a multiple-testing bar help prevent accidental relationships from becoming recommendations.
- Find bundles, not just pairs. Golden can flag groups of products whose relationships make sense together.
- Keep the analysis transparent. Ranked results show the strongest relationships, while the full pair view keeps the unsuccessful tests visible for context.
- Know when not to act. When there is not enough data to support a conclusion, Golden says so.
The output is ready to explore. Analysts can compare the strongest relationships, see the evidence behind them, and move from a statistical result to a practical decision without rebuilding the workflow in code.
From pairs to practical decisions
The analysis is built to be explored, not handed over as a static table.
A ranked view shows the strongest combinations and their exact measures. A scatter plot shows every pair, including the ones that did not clear the statistical bar. Select a relationship and the analysis can focus on the baskets behind it.
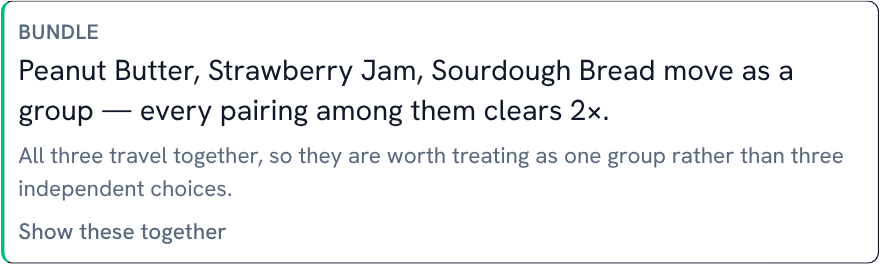
Golden can also surface groups. When Peanut Butter, Strawberry Jam, and Sourdough Bread each have meaningful relationships with the others, they can be understood as one bundle instead of three disconnected findings.
That gives merchandising, marketing, and product teams something they can use:
- Create bundles based on observed behavior
- Choose more relevant cross-sell recommendations
- Plan product placement and promotions
- Find combinations that raw sales rankings miss
More than retail baskets
The same method works anywhere data has a group and a set of items.
An order contains products. A survey respondent selects answers. A customer account adopts services. A user engages with product features.
The business question changes, but the analytical question stays the same: what travels together more often than chance?
Built for analysts
Analysts have always been able to run market basket analysis. That was never the problem.
The problem was the setup. Turning raw transaction rows into a trustworthy answer required code, statistical choices, and a lot of time explaining why the most frequent pair was not necessarily the most useful one.
Golden removes that mechanical work while keeping the evidence visible.
Less time generating combinations.
More time deciding what to do with them.
That’s exactly why we built this.