October 2026 Feature Summary
Golden now reads the semantic layer your data team already built and connects to Fabric and Azure SQL. October also brought 7 new chart types, dashboard tabs and a design editor.
October's list is long, so I'll keep this part short.
The biggest change is that Golden now reads the definitions your data team already wrote. Point it at a Snowflake semantic view, a Databricks metric view or an OSI file, and the AI answers with your metrics, calculated the way your team defined them. Fabric and Azure SQL users can connect now too.
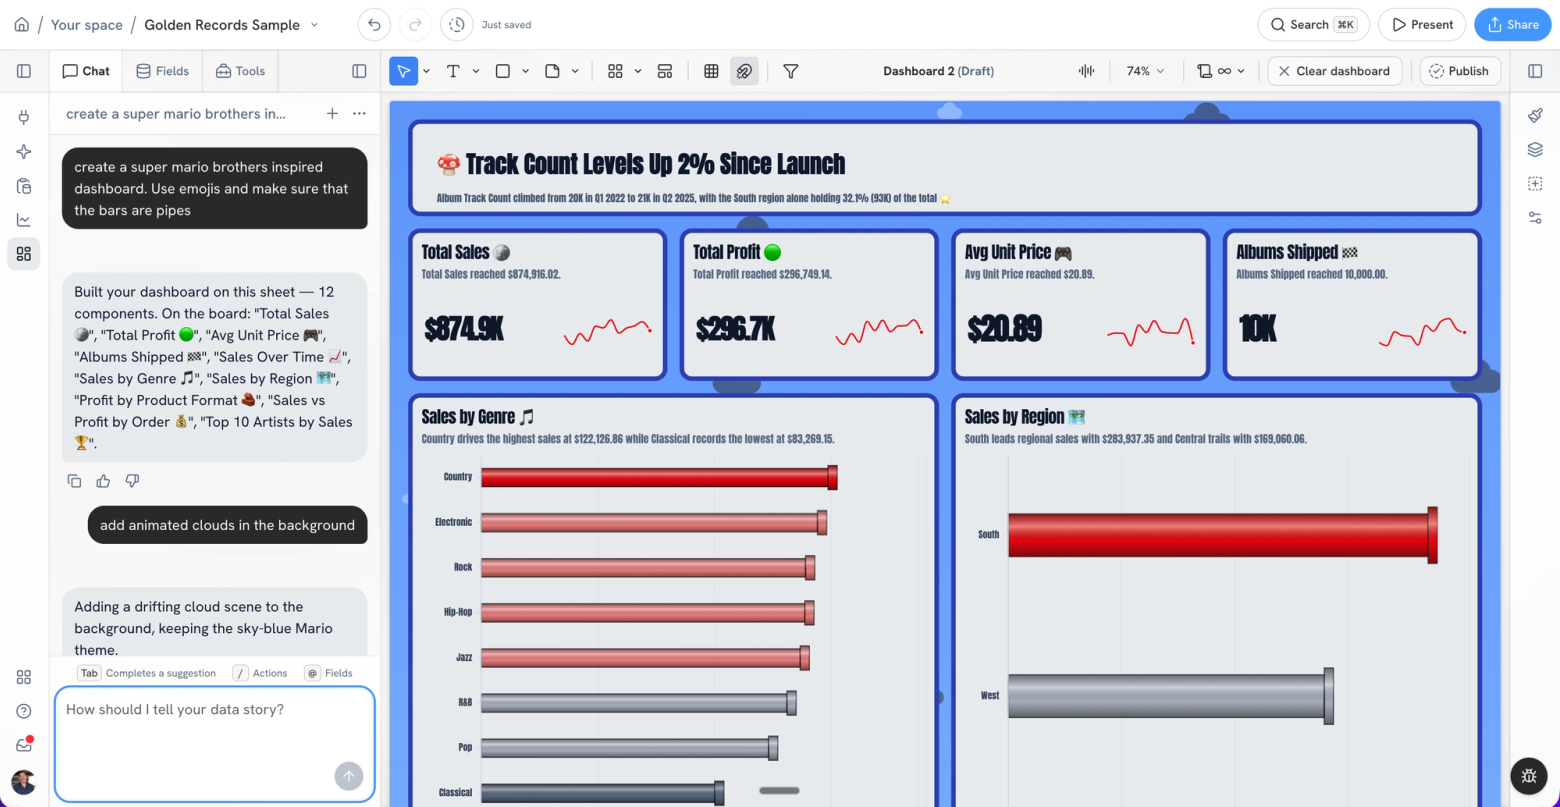
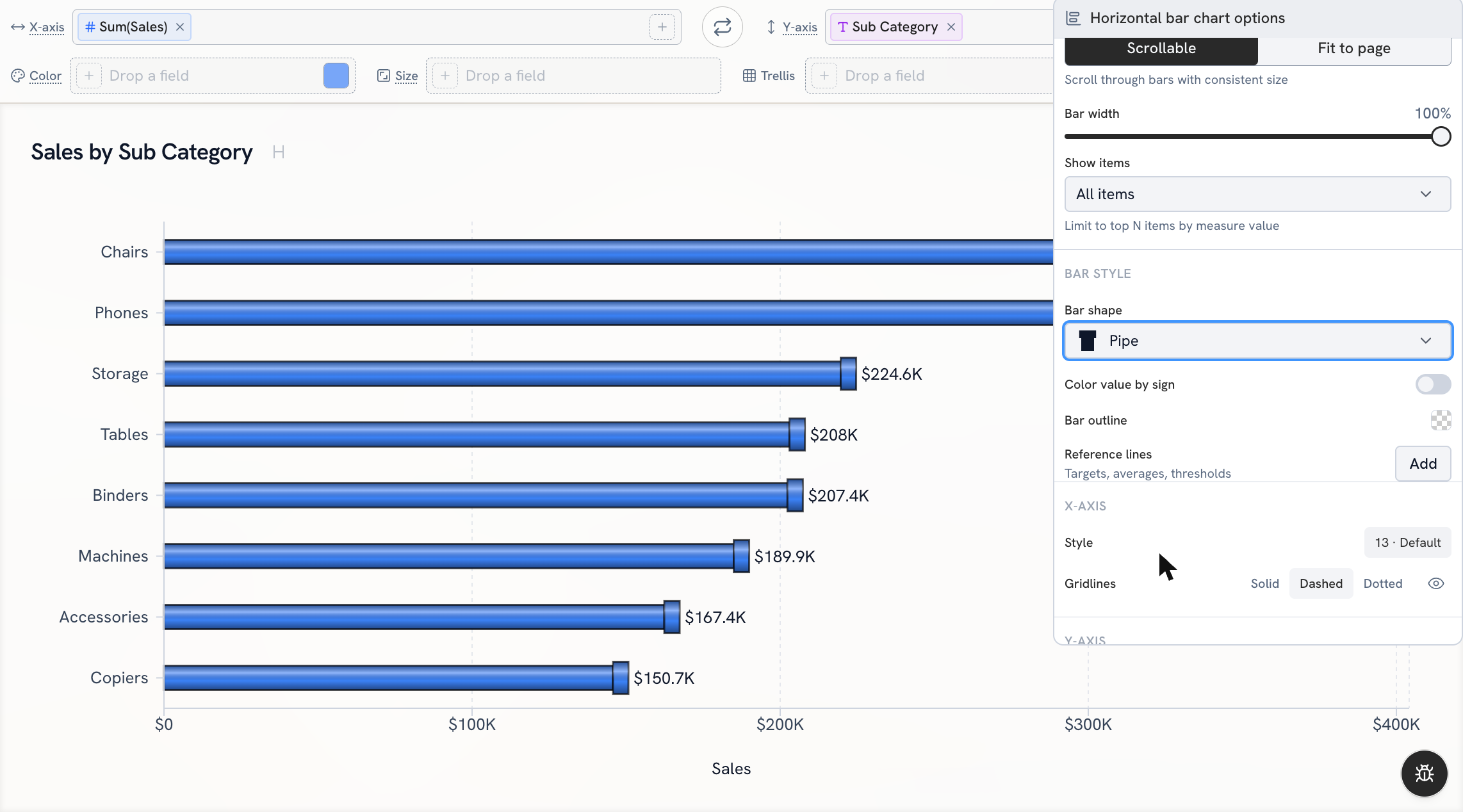
Then there's the fun stuff: 7 new chart types, tabs that turn a dashboard into a small app, KPI cards that tell you whether a number is good or bad, and bar shapes (a Super Mario theme draws its bars as pipes, which is exactly as fun as it sounds).
Highlights first, then everything else.
In this post
Highlights
- Bring your semantic layer: Snowflake, Databricks and OSI
- Connect Microsoft Fabric and Azure SQL Database
- 7 new chart types
- Turn dashboards into apps with navigation tabs
- Give a dashboard your own look
- Bring your data dictionary in any format
- Make KPI cards say more
- Pick a shape for your bars
Everything else
- Warehouses: faster and cheaper to run
- Charts and analysis
- Calculated fields
- Dashboards
- Chat
- Data
- Export and sharing
- Everyday polish
Highlights
Bring your semantic layer: Snowflake, Databricks and OSI
Your data team spent months defining what "revenue" and "active customer" mean. Those definitions should travel with the data, and now they do.
Import a Snowflake semantic view or a Databricks metric view as a dataset and chart it right away. Golden asks the warehouse for each metric by name, so the aggregation your team defined is the one you get. You can't accidentally sum an average.
Semantic views work across the product: insights, AI summaries, chart suggestions, Key Questions, calculated fields, period comparisons and change drivers. You can join one to a regular table, too.
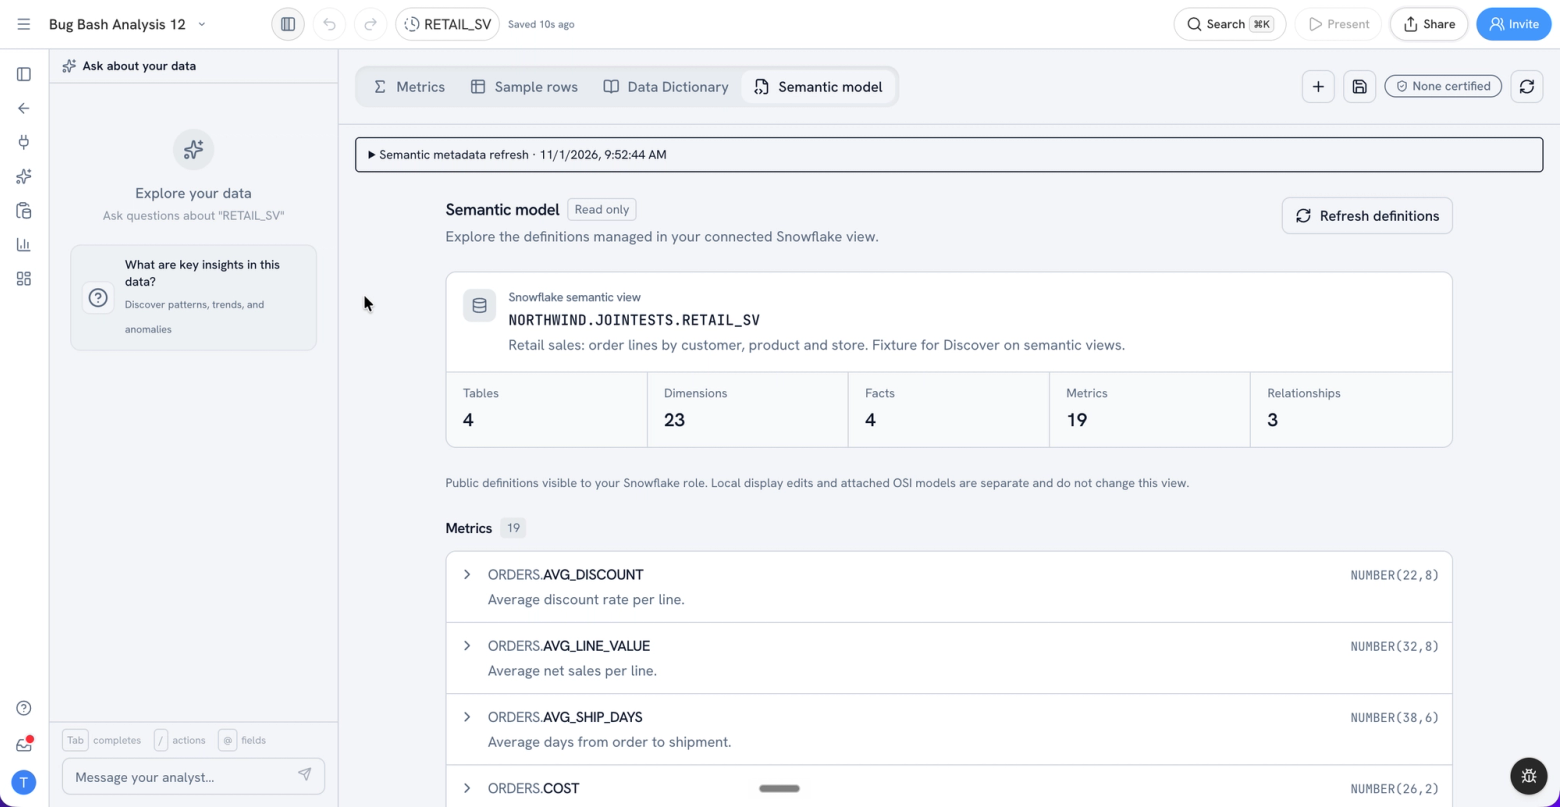
Don't run either warehouse? Upload an Open Semantic Interchange (OSI) model as YAML. Golden applies its descriptions, synonyms, display names and certified metrics to your dataset, and you can view and edit the YAML on the new Semantic model tab in Prepare. Snowflake definitions show up there too, with sample rows for each logical table, and you can pick which certified metrics to import.
So when you ask a question, the AI answers with your company's numbers, defined once by the people who own them.
Connect Microsoft Fabric and Azure SQL Database
If your company runs on Microsoft, Golden now plugs right in.
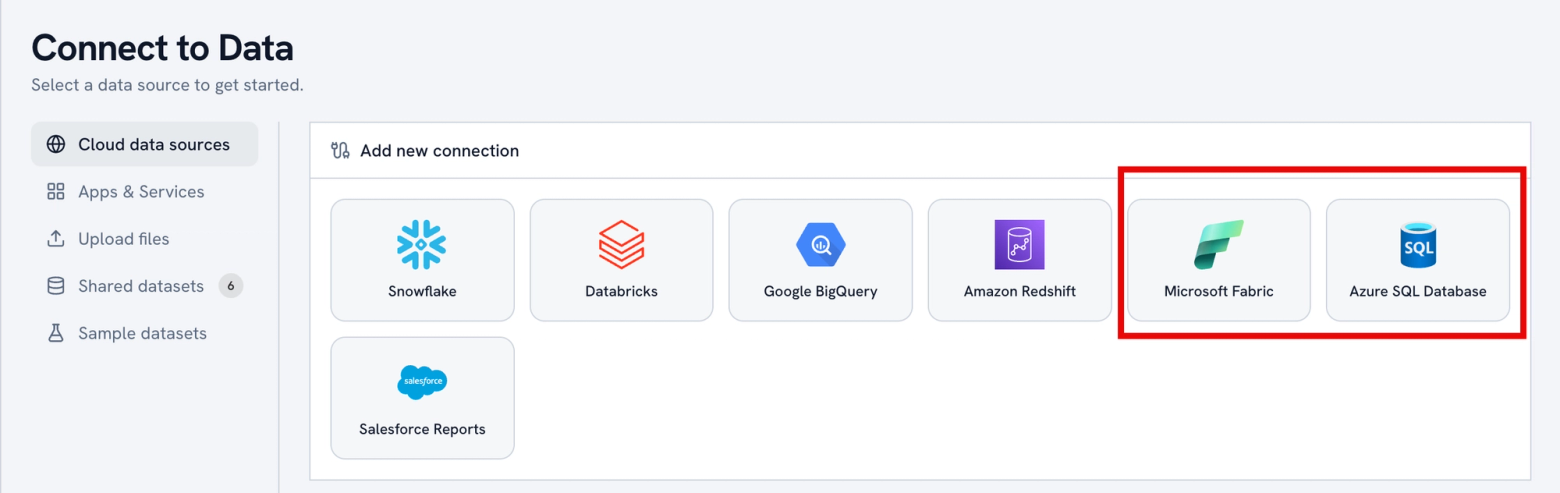
Azure SQL Database is a new connector, and Microsoft Fabric is out of preview, rebuilt on the same engine. Sign in with your Microsoft account, use an Entra service principal, or use a SQL username and password. Fabric gets a real schema browser, and filtered queries come back filtered.
A huge share of companies keep their data in Microsoft. Their analysts can now use Golden without anyone moving data first.
7 new chart types
This is the biggest chart release we've done. Each one answers a question people kept forcing into a bar chart:
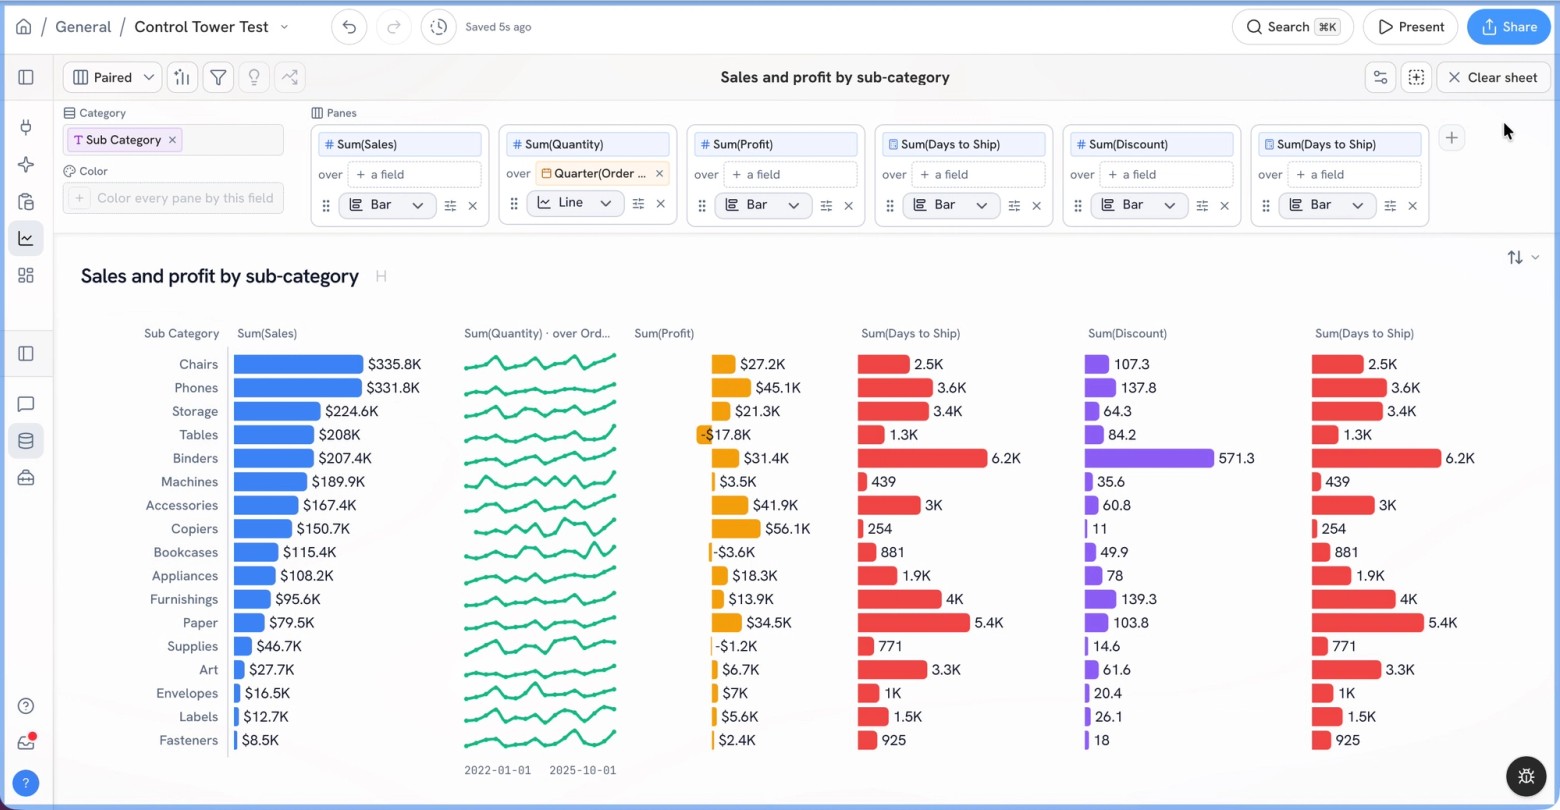
- Paired chart: a bar and its trend side by side, with a year-over-year view that follows your date filter. "How big is it, and which way is it going?"
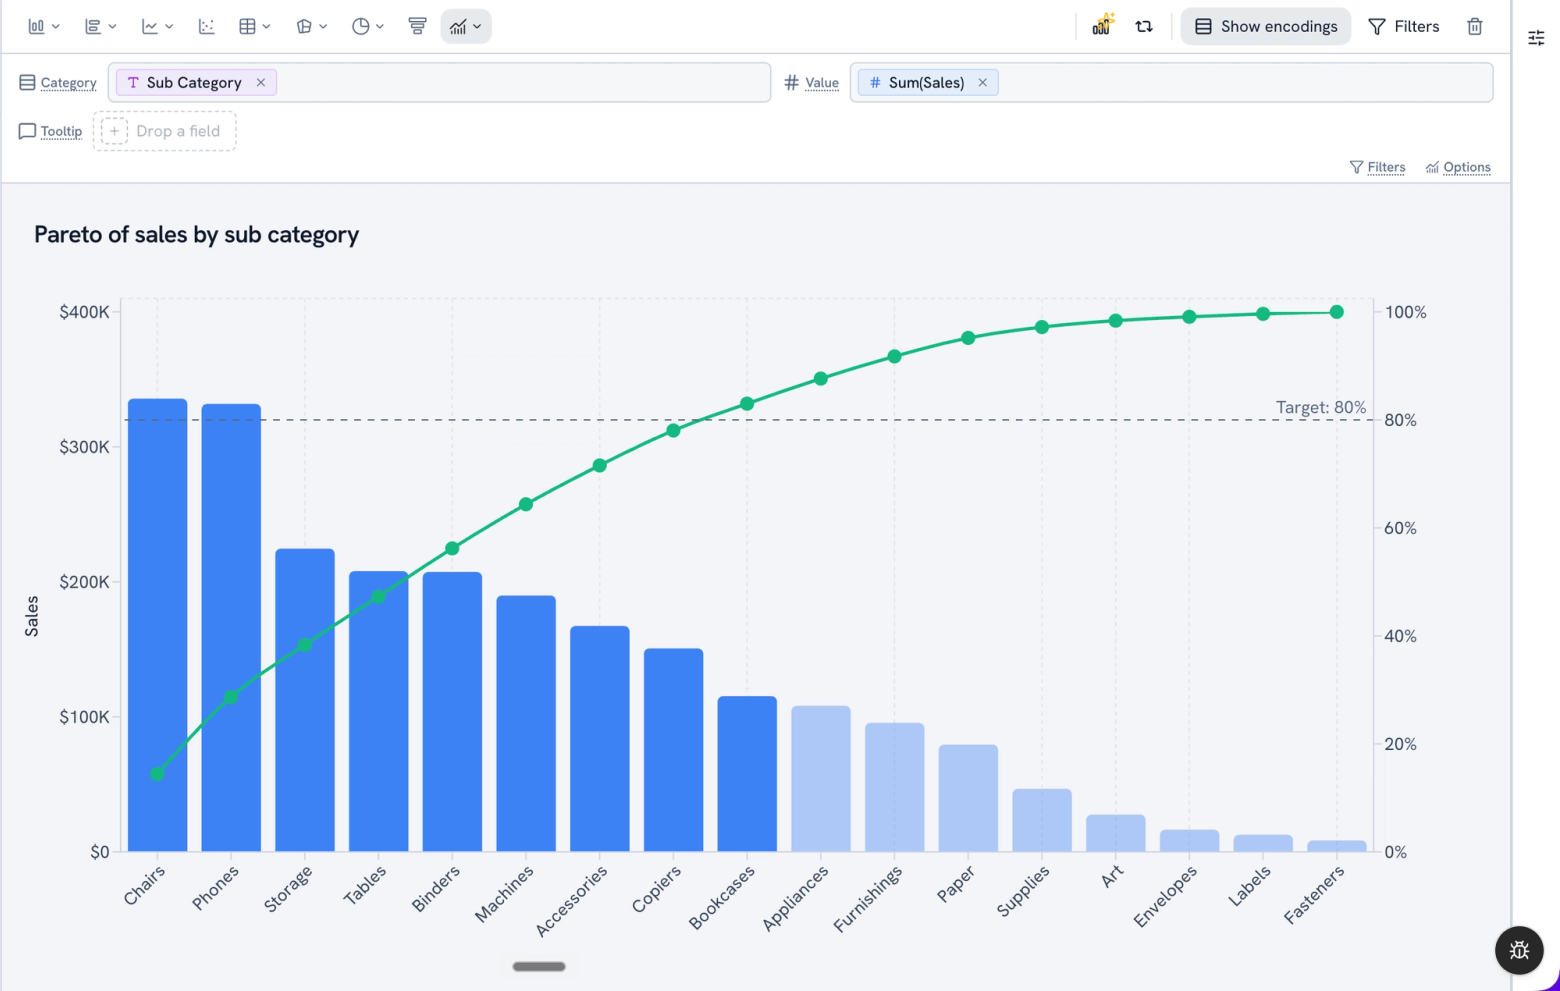
- Pareto: bars sorted high to low with a cumulative line. "Which few items drive most of the total?" (It replaces the old Combo chart.)
- Bullet: actual against target with shaded ranges, in the space a gauge wastes.
- Slope: every member's change between 2 periods, one line each.
- Interval plot: an estimate with its low and high bounds.
- Dot plot: clean comparisons when bars would crowd each other.
- Strip plot: every value in a distribution, so you see what a box plot hides.
We also rebuilt the chart picker with search, added style variants for radial charts, gave area charts a Stack areas switch and made every Sankey option actually work. Chat can build all of them.
Turn dashboards into apps with navigation tabs
One dashboard rarely tells the whole story, so people end up sending around five links. Now you can put them all in one place.
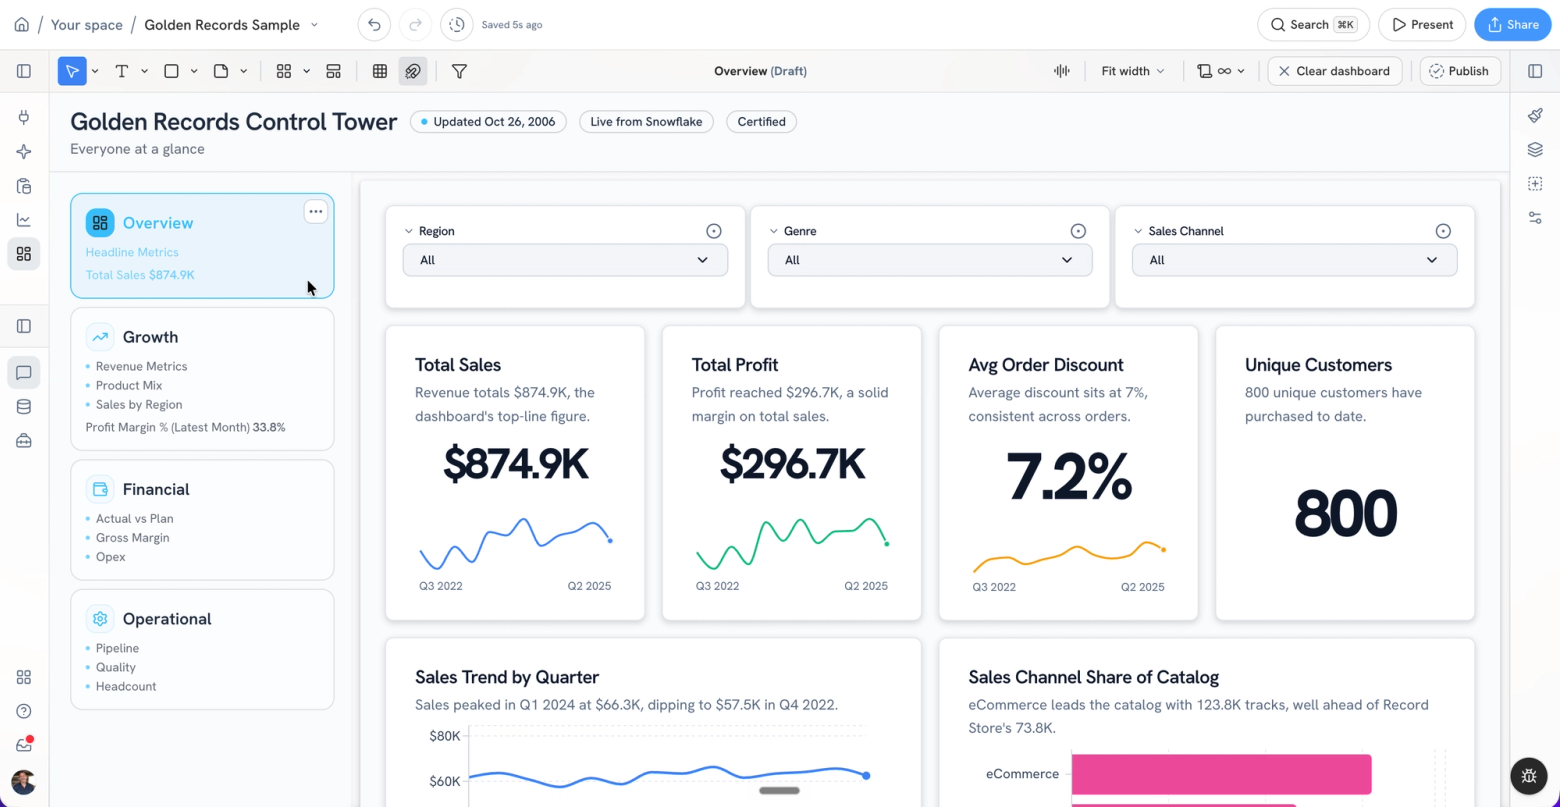
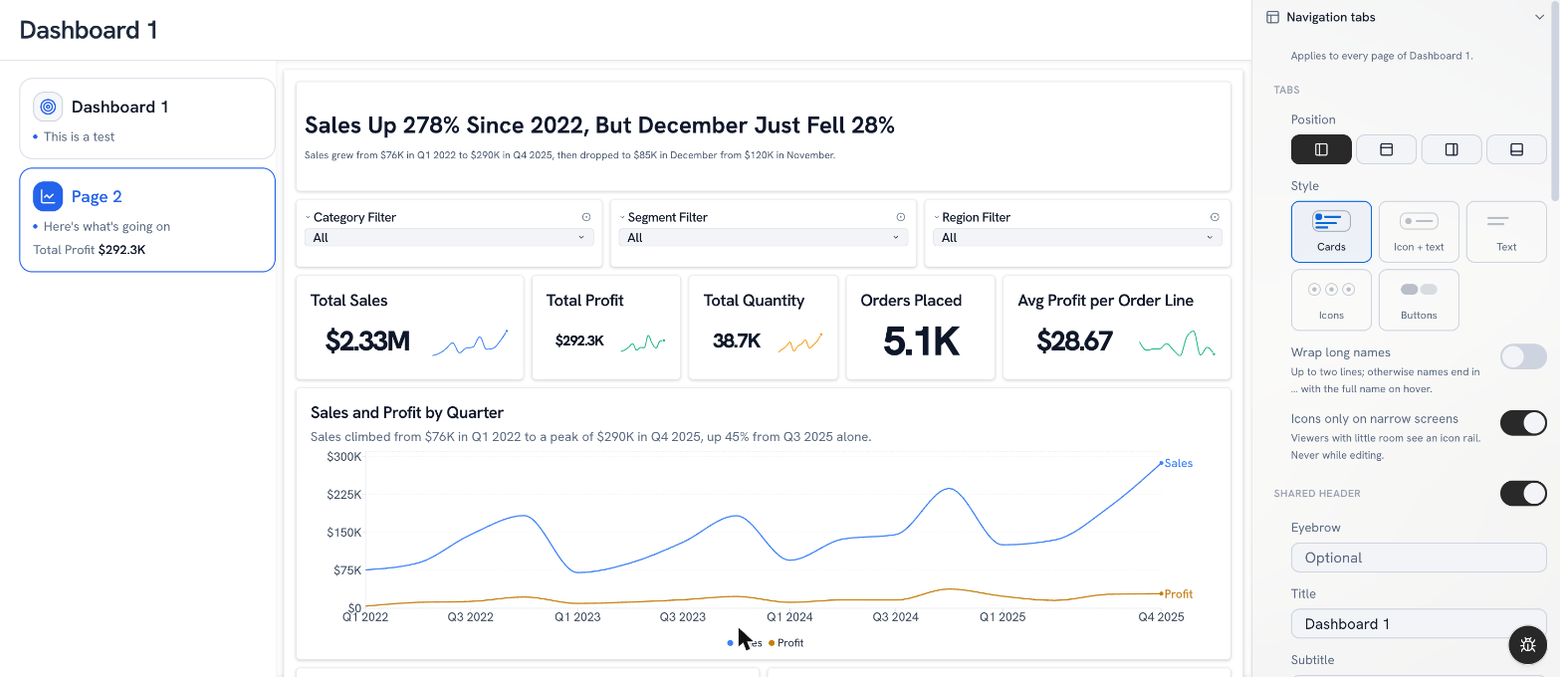
Add navigation tabs and your dashboard becomes a tabbed app: one header, a tab strip on the top, bottom or either side, and a full dashboard page behind each tab. Picture a control tower for your CEO and CFO with Overview, Growth, Financial and Operational, all one click apart. Each tab can carry an icon, a description and a headline metric, and a tab's queries only run when someone opens it.
Navigation tabs are rolling out to a first group of customers now, with everyone else to follow.
Golden can now hold the full operating view for a team or a whole company, the kind of thing that used to need a custom portal.
Give a dashboard your own look
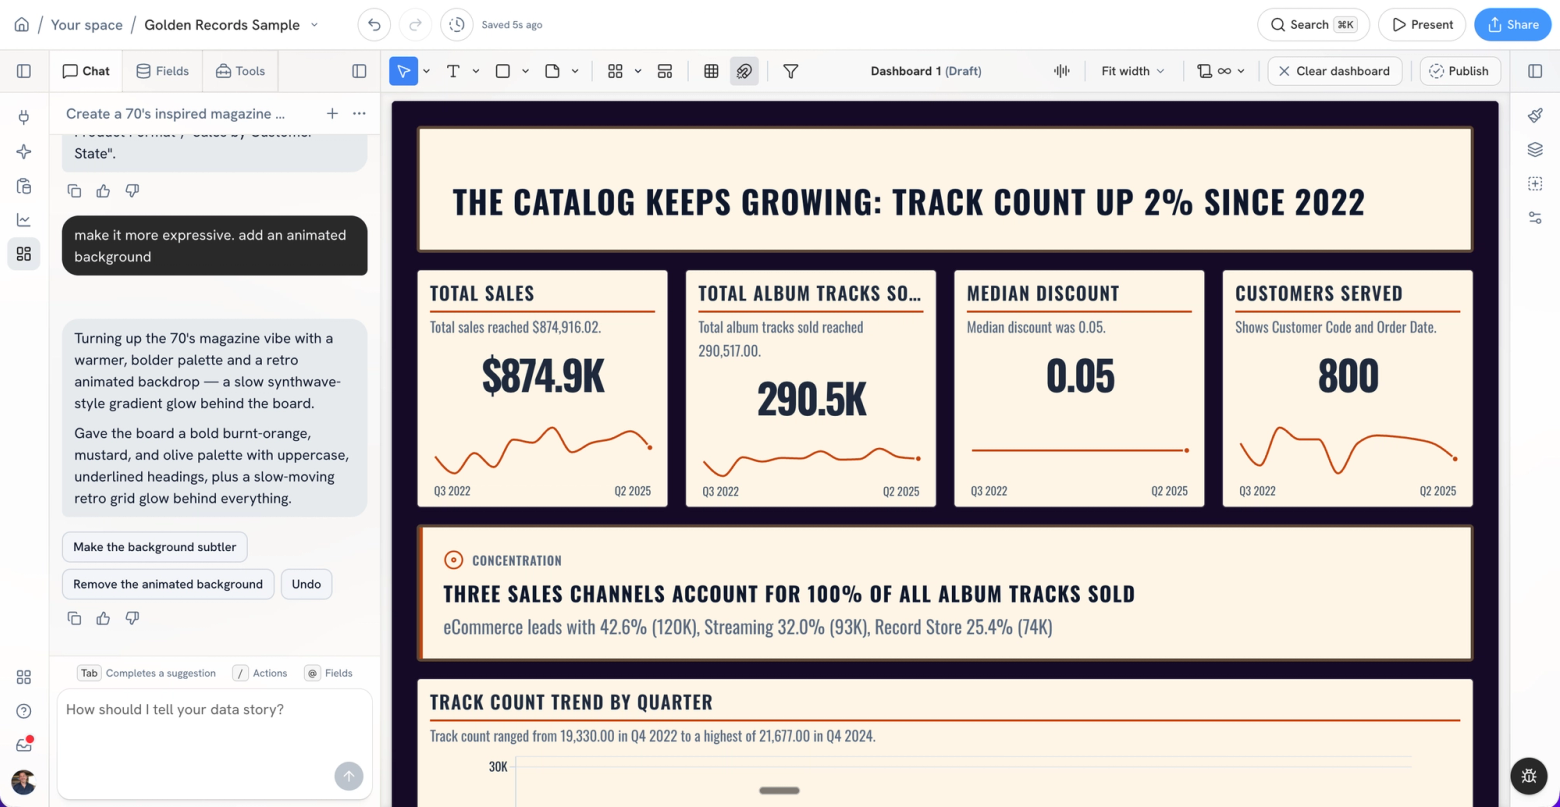
Dashboards now have a design editor. Pick a theme, save your own, and override individual cards when one needs to stand out (a hero KPI, say).
Or just ask. Tell chat what you want the board to feel like and it restyles everything while your analysis stays exactly where it was. Ask for snowfall, a starfield or a synthwave grid and the board gets an animated background to match.
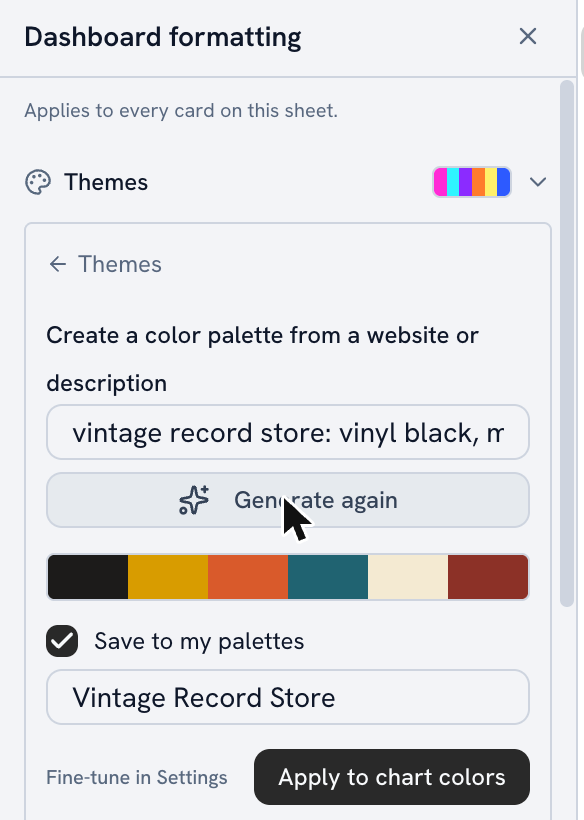
Need brand colors? Type a website or describe the brand right in the Format pane or the Themes rail, and Golden builds a palette you can apply to one sheet or the whole dashboard.
Bring your data dictionary in any format
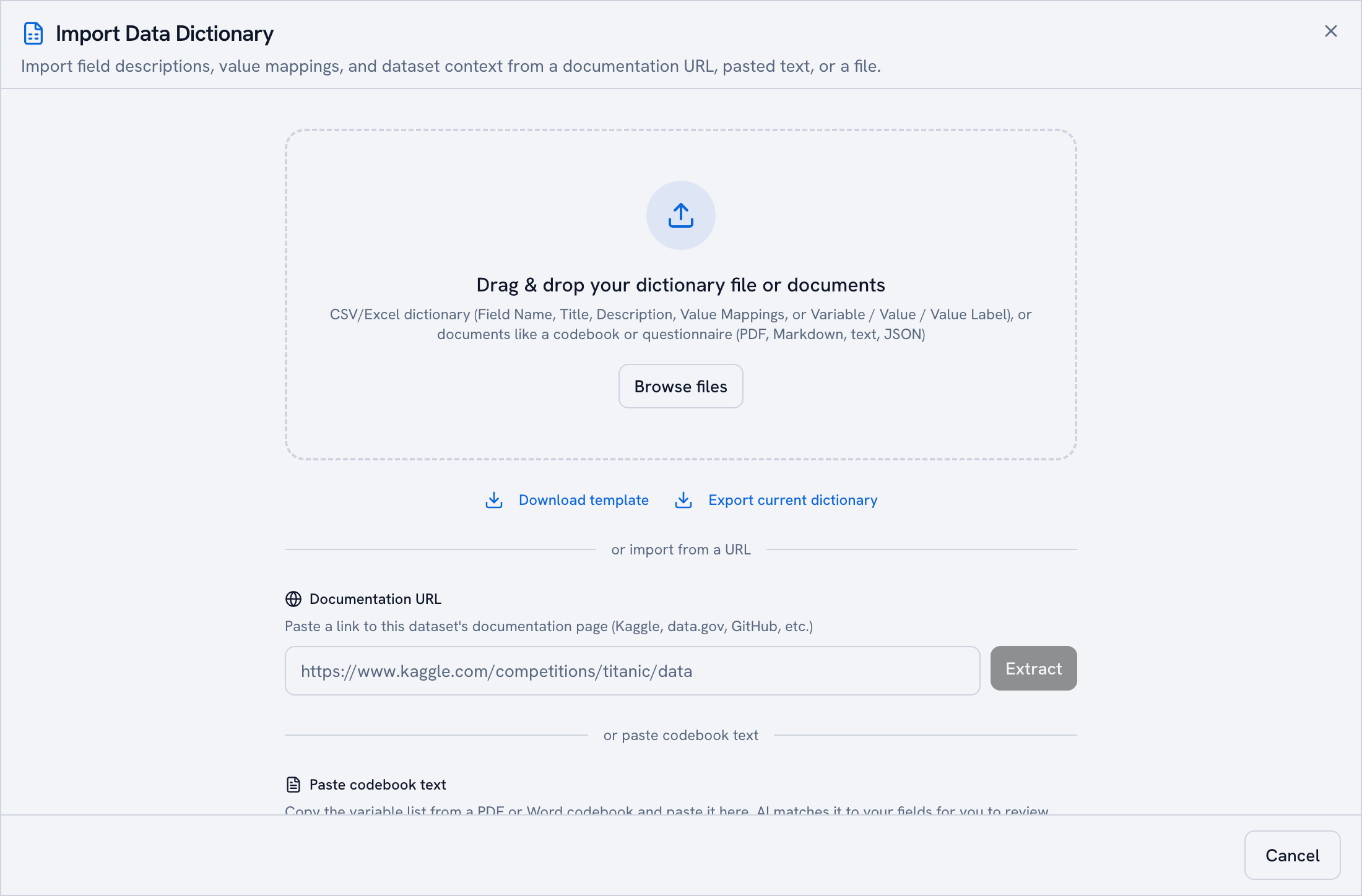
Your team's definitions usually live in a PDF someone wrote two years ago. Import it as is: PDF, Markdown, plain text or JSON.
Survey codebooks work too. Golden reads the question labels and answer codes, and survey data gets boards built for it: NPS across waves, wave-over-wave movement and key drivers.
Make KPI cards say more
A KPI card used to show a number and not much else. Now it can tell you how that number is doing.
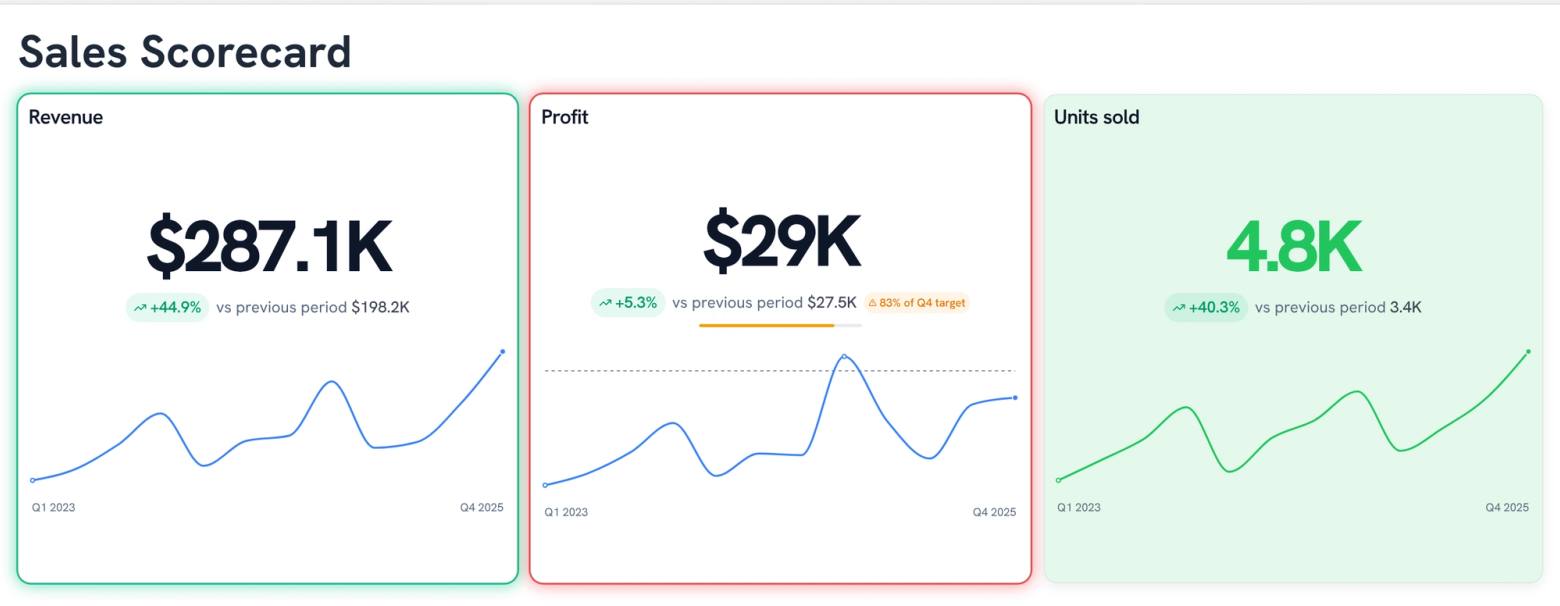
Show the change as a percent, an amount or both (−$33.3K, −28.1%), with a "vs previous period" caption. Draw last period as a dashed line behind the sparkline. Let conditional formatting color just the number, tint the whole card or add a colored edge. Cards also adapt to their size, so small ones drop the extras and large ones add range labels.
Turn on KPI glow and the board rings the cards that need attention, judged against each card's goal or its change from last period. Chat can set all of it.
A glance at the top row tells you what's on track and what isn't.
Pick a shape for your bars
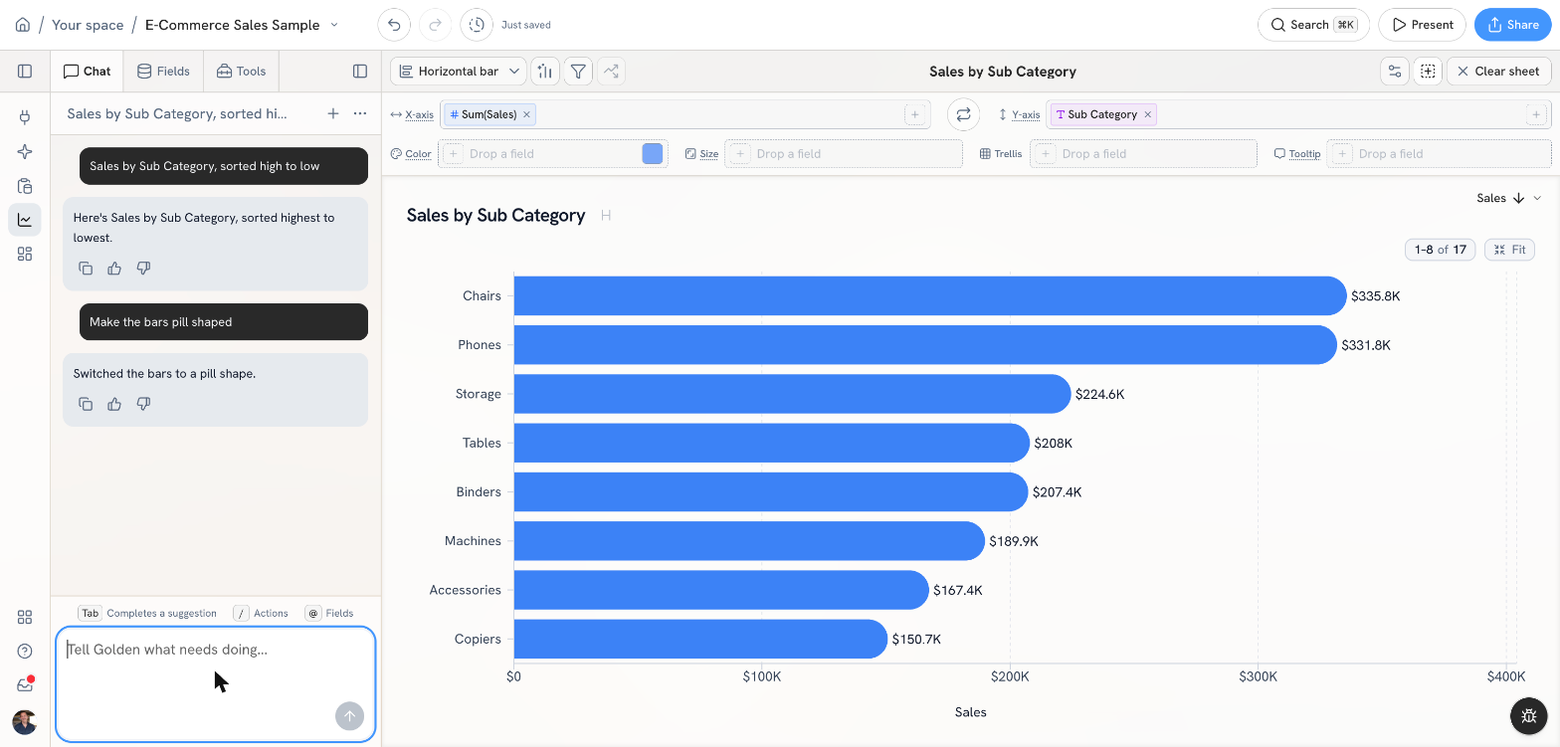
Bar charts can now draw square, rounded, pill, pipe or pointed bars. Pick one in the format pane, ask chat ("make the bars rounded") or let a dashboard theme choose one for the whole board.
Everything else
Warehouses: faster and cheaper to run
- Pull fields out of a JSON column on a live warehouse dataset, without copying the data.
- See when your warehouse's descriptions and tags last refreshed, and what each refresh could read.
- Live BigQuery queries are faster, with a quick lane for short queries.
- Cap how many bytes a BigQuery query can scan. Automatic queries pause when you hit your quota, and abandoned jobs are canceled.
- BigQuery connections can run per-user: each teammate signs in with their own Google account and sees what their own permissions allow.
- Databricks: results over the size limit come back trimmed and flagged instead of failing, big IDs and exact decimals stay exact, new connections sign in as you, and service principals are supported.
- Dozens of BigQuery and Redshift fixes: date and numeric filters, apostrophes in values, GEOGRAPHY columns, 64-bit IDs and empty strings.
- When a warehouse table changes, a broken chart tells you which column is gone.
Charts and analysis
- Number columns get an "Is in the highest N" filter.
- Copy a tooltip's values with one click.
- Align the Y-axis labels on horizontal bar charts.
- Columns named average, max or min default to that statistic instead of Sum.
- Conditional formatting rules on a percent column read in percent.
- Control bands: shade a chart at the average plus or minus a few standard deviations, or ask chat to add one.
- Right-click a bar to copy its label and value.
- Tell a date column to draw only the dates in your data, as categories instead of a timeline. Handy for survey waves.
- Hover, click and drag stay smooth on scatters with tens of thousands of points.
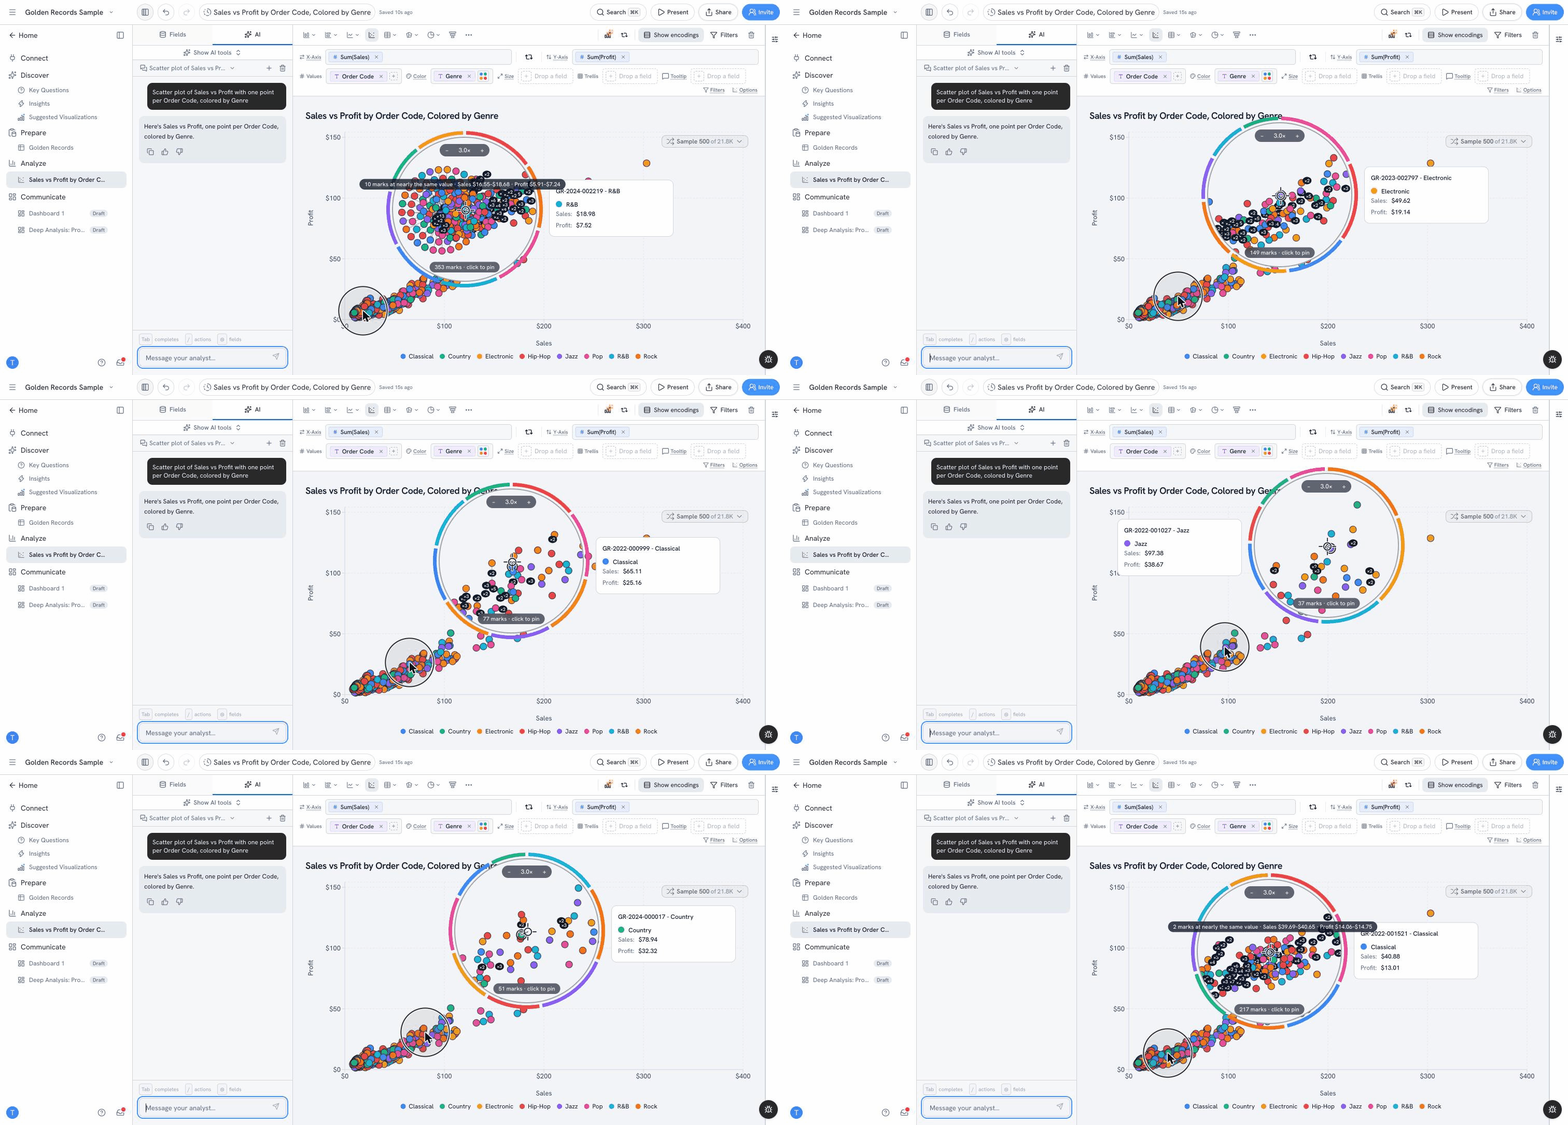
- On a crowded scatter, a loupe spreads apart the points stacked under your cursor, so you can pick one out, pin it, and keep, exclude or view the data behind it. It works on dashboard scatters too, and you choose when it appears: over overlaps, always or never.
- Pivot tables support multi-level column headers, order dates by time and follow the chart's sort.
- New filter: "Is the highest in data," so "the latest round" stays current as data arrives.
- Top/Bottom N works on tables, maps and funnels.
- Reference lines work on horizontal bar charts.
- Hover over a point for a moment to pin its tooltip.
- Add tooltip fields from the Format pane.
- Custom prefixes and suffixes in number formats.
Calculated fields
- Browse every function with search and insert it at your cursor.
- Type
@to autocomplete a field name. - New
RANGE_LOOKUPtags rows by date range (fiscal periods, campaigns, promo windows). - New fields pick sensible decimal places from the formula.
Dashboards
- View the SQL behind any dashboard chart from its More menu.
- Navigation tabs get a selected-tab style and an "About this data" notes panel.
- Key Questions cards appear one at a time as they're ready.
- Edit a subtitle right on the card, with a format toolbar.
- Wrap long chart titles.
- Filters that don't fit collapse into "+N more."
- It's now obvious when a chart click has filtered the rest of the board.
- Drag sheets onto the dashboard from the collapsed side rail.
- Add an image from the dashboard Shape menu.
Chat
- Insights, Key Questions and generated dashboards come back in your language, and the chat box autocompletes in it too.
- Chat replies in your language.
- Copy button on every chat message.
- Undo steps back one chat turn at a time.
- Chat tells you what it changed, including when there was nothing to change.
- Ask for whole numbers and you get full figures, like 3,214 instead of 3.2K.
Data
- Combine imported tables from Prepare: drag one onto another, or use Tools → Table shape → Combine tables.
- Number column headers in Prepare show a mini histogram, and the data dictionary shows unique counts, nulls and sample values.
- "Fill empty values" suggests fills that match the column's type.
- A CSV without a header row gets its columns named automatically.
- Spreadsheet errors and a lone hyphen in number columns import as empty cells.
- Columns with non-English names get the right types.
- Golden uses what Salesforce and Google Sheets already know about each column's type.
- HubSpot imports are more compact, with sharper insights and boards.
Export and sharing
- Exports match the size of the canvas you see.
- New A4 Portrait export size.
- Exported files are named after your analysis.
- Copy image lets you pick and order tiles.
Everyday polish
- New accounts start on Home with three clear ways to bring in data.
- About 180 fewer pop-up notifications, and the rest are in plain English.
- Empty states for the galleries, a new sheet and a new dashboard.
- Drop a file anywhere on the Connect page to upload it.
- The app loads faster for returning visitors, analyses open faster, and Home and Space pages work on narrow screens.
- After a release, open tabs prompt you to reload instead of showing an error.
- Space editors can delete analyses.
I love months like this one.
Try it, break it, and hit the feedback button in the app to tell us what you want next. We read every single one (I do too, usually with coffee).