Build a chart with shelves
Drag fields onto shelves like X-Axis, Y-Axis, Color, Size, Trellis, and Tooltip — or drop them straight onto the chart — to compose any chart.
Golden's chart builder follows a Tableau-style shelf model. You pick a chart type, then drag fields from your dataset onto labelled shelves. The chart re-renders as you go.
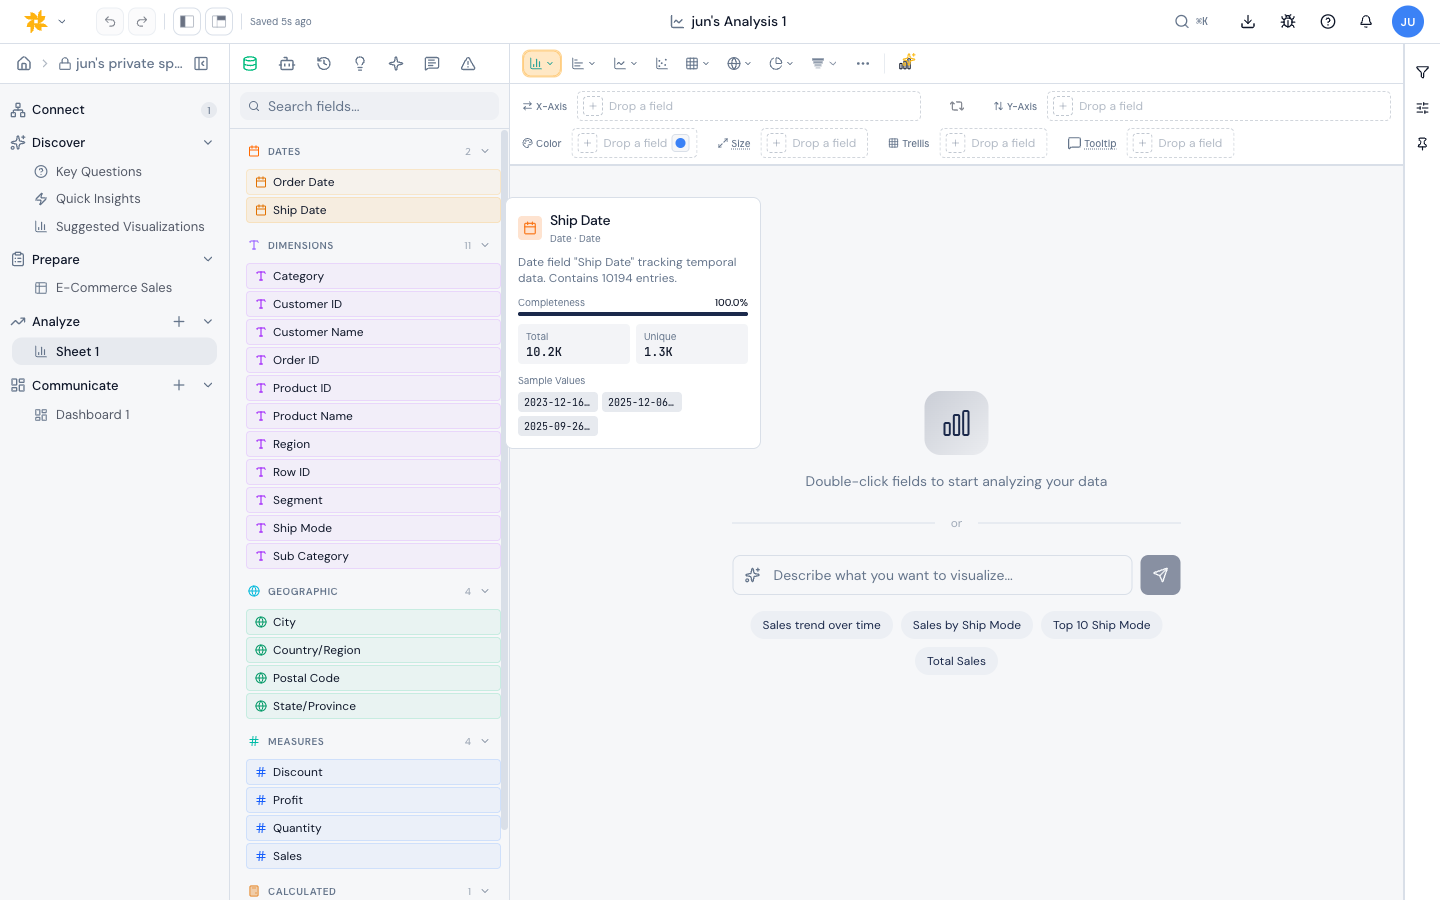
The shelves
Shelves change depending on the chart type. The most common ones:
- X-Axis - the field that lays out across the bottom (or up the side for horizontal bars). Accepts multiple fields.
- Y-Axis - the measure plotted as height. Accepts multiple fields to plot several measures together.
- Color - splits or colors the marks by a dimension, or sets a per-measure palette.
- Size - scales mark size by a measure (used by scatter, bubble, and similar).
- Trellis - splits the chart into small multiples by a dimension.
- Tooltip - extra fields that show up only in the hover tooltip.
Building a chart
- Pick a chart type from the right toolbar.
- Drag a dimension onto the X-Axis (or Slices, for pie/donut).
- Drag a measure onto the Y-Axis (or Values).
- Optionally drop fields on Color, Size, Trellis, or Tooltip to refine.
- Use the field pill menu on any shelf to switch aggregation, sort, or formatting.
Drop a field onto the chart
You don't have to aim for a shelf. Drag a field from the Fields panel over the chart itself and the chart splits into drop zones, each labelled with what it would do — "Add to X-axis", "Replace Y-axis", "Break down by Color", and so on. These are the same choices you'd get dropping the field on a dashboard tile. Release over a zone to place the field there. The zones appear only while a field is in flight, so the chart keeps its normal clicks, brushing, and tooltips the rest of the time — and they work even when the shelf area is collapsed.
Breaking a bar chart down by color
When you add a dimension to a bar chart's Color shelf, Golden stacks the bars by that dimension rather than drawing a separate bar for every combination. Ten states broken down by three categories become ten stacked bars, not thirty. Horizontal bars stack the same way. Dropping a dimension onto a bar chart whose category axis is already filled defaults to this color breakdown; nesting the field on the axis instead is the next option down in the drop menu.
Every shelf shows a placeholder when empty, so you can see which fields a chart still needs before it will render.