Chart types in Golden
A tour of every chart type Golden can render, grouped by what they're good at.
3 min readUpdated October 10, 2026
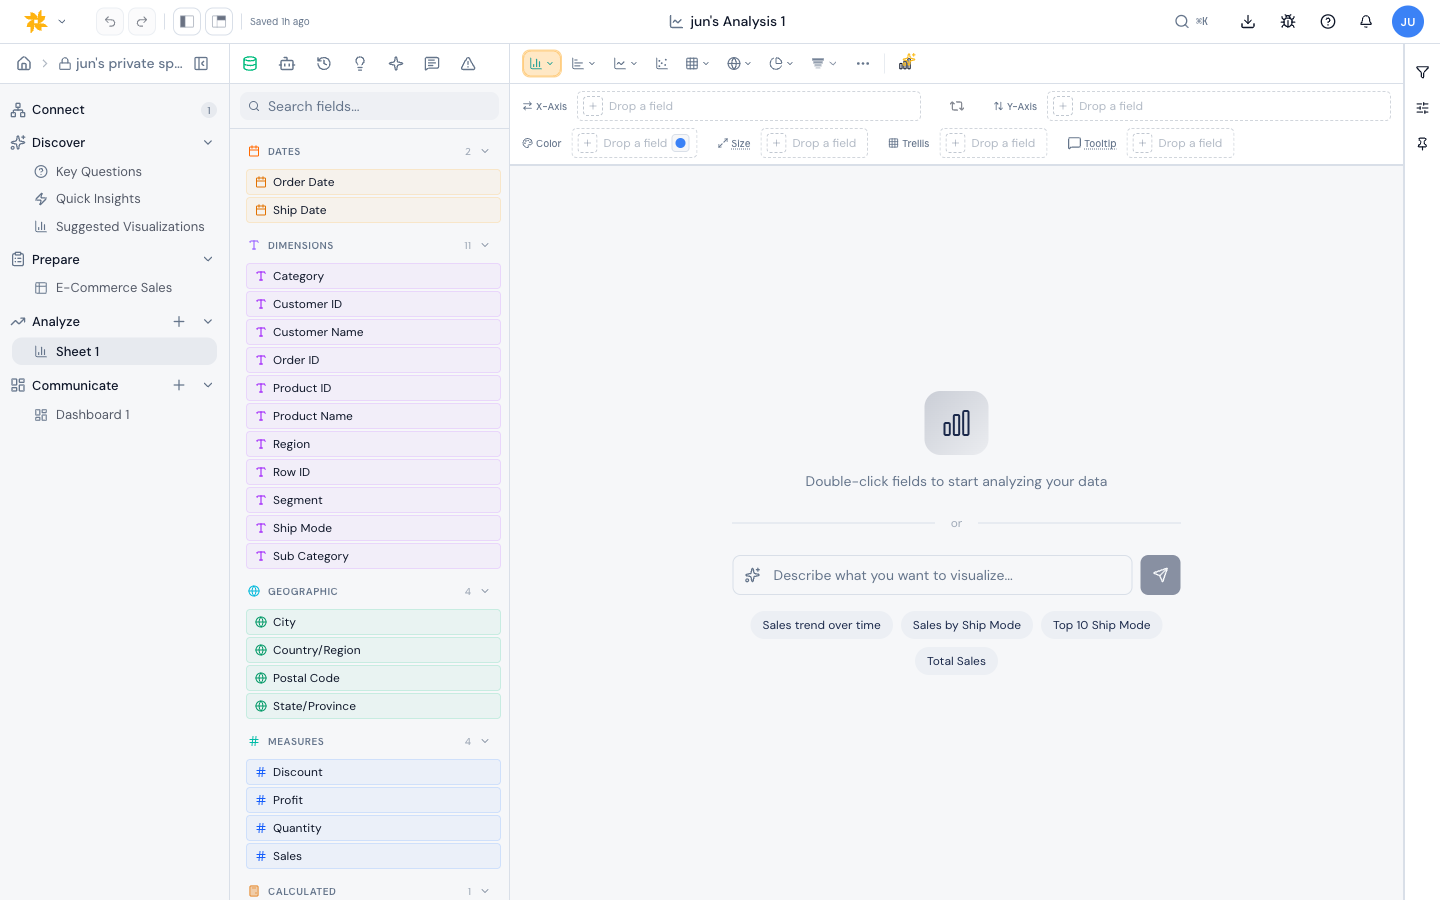
Golden ships a wide chart library. Each type has its own shelves and rendering rules. You can switch between them at any time from the chart type selector.
Comparison
- Bar - vertical bars, one per category.
- Horizontal bar - bars laid on their side.
- Stacked bar - segments stacked within each bar.
- 100% stacked bar - stacked bars normalized to 100%.
- Horizontal stacked bar and 100% horizontal stacked bar - the horizontal variants.
- Diverging bar - bars that split on both sides of a baseline.
- Lollipop and dot plot - a dot at each value, on a thin stick or, as a dot plot, on its own.
- Range bar - bars showing a span from start to end.
- Interval plot - a point estimate drawn on a thin whisker from a low to a high value, for showing a value with its range.
- Bullet - a single measure drawn against a target, over shaded qualitative bands, for progress toward a goal.
- Radial - polar layouts including radar, radial bar, stellar, radial lollipop, and sunburst.
Trend
- Line - classic time-series.
- Area - filled line.
- Stacked area and 100% stacked area - layered area charts.
- Combo - mix bar and line on the same axes.
Distribution
- Histogram - bins for a single measure.
- Box plot - quartiles, median, whiskers, and outliers.
- Scatter - one mark per row across two measures.
Composition
- Pie and donut - share of a whole.
- Treemap - nested rectangles sized by measure.
- Sankey - flow between categories.
- Funnel - step-by-step drop-off.
- Waterfall - running total with positive and negative steps.
Geographic
- Map - generic map render.
- Shape map - colored regions.
- Filled map and choropleth - region-shaded thematic maps.
- Density map and heatmap - point density on a map.
Tables and KPIs
- Table - a flat data grid.
- Pivot table - rows, columns, and aggregated values.
- Matrix heatmap - a colored grid with optional row or column normalization.
- KPI and big number - a single headline figure.
Specialized
- Word cloud - sized text from a categorical field.
- Retention - cohort retention grid.
- Gantt - tasks on a time axis.
Note: Not every shelf appears on every chart type. The builder shows you exactly which shelves a chart accepts.