Data Dictionary
Load field titles, descriptions, and coded-value meanings from a spreadsheet or survey codebook, from a PDF or other document, or from a documentation page - reviewing every row before anything is applied.
Every dataset in Golden comes with a Data Dictionary. It profiles each field (completeness, unique values, ranges, the most common value), lets you set how numbers and dates display everywhere, and holds the descriptions that help you, your teammates and Golden's AI read your data correctly.
When to use it
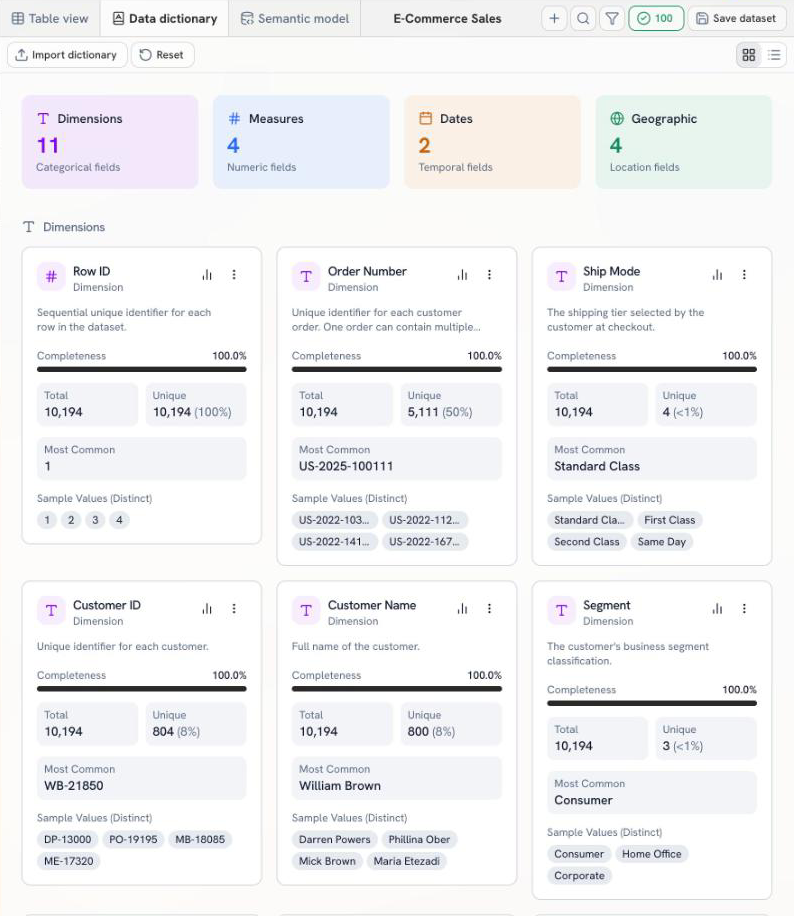
- The first look at a new file. An analyst gets a 10,000-row orders export. Before building a single chart, they scan the dictionary and see that Row ID is 100% unique and Order ID only 50%, so one order spans several rows.
- The team that already wrote it down. A data lead keeps a spreadsheet saying "Profit can be negative" and "Region doesn't apply to Canadian orders." They import it once, and every teammate and every AI answer reads the same definitions.
- The board deck that needs dollars. An ops manager sets Sales and Profit to Currency with 2 decimals here, so every dashboard shows
$228.23instead of228.2299. - The handoff. Someone new joins the team. Export current dictionary gives them a spreadsheet of what every field means, with no Slack thread required.
If someone keeps asking "what does this column mean?", it's time to fill in the dictionary.
Open the Data Dictionary
- Open an analysis and go to Prepare.
- Click the Data dictionary tab, next to Table view.
The tiles at the top count your fields by kind: Dimensions (categorical fields), Measures (numeric fields), Dates (temporal fields) and Geographic (location fields). Below them, every field gets a card, grouped the same way.
What each field card shows
| Item | What it tells you |
|---|---|
| Description | What the field holds. Golden writes a starting one; yours or an imported one replaces it. |
| Completeness | The share of rows that have a value. |
| Total and Unique | How many values the field has, and how many are distinct. |
| Most Common | The value that shows up most (dimensions and geographic fields). |
| Range / Date Range | The lowest and highest value (measures), or the first and last date (dates). |
| Sample Values (Distinct) | A few real values, so you can see the format at a glance. |
Click the chart icon on a card to see its values as % of Total bars. Ship Mode, for example, is 60.0% Standard Class.
Click a field's name to rename it.
Set how a field displays
Measure cards carry the settings that control how a number looks everywhere you use it.
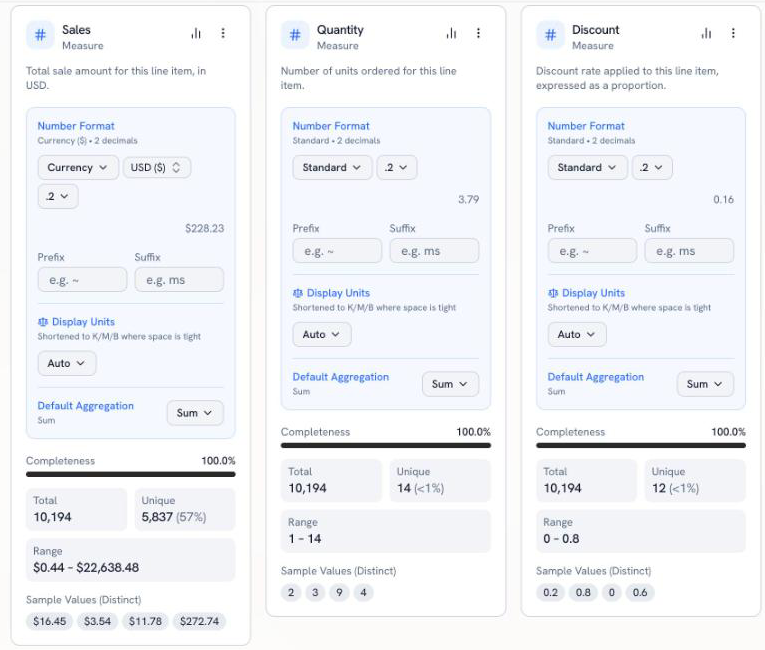
| Setting | What it does |
|---|---|
| Number Format | Standard, Currency (with a currency picker) and more, plus the number of decimals. A live preview shows the result. |
| Prefix / Suffix | Text before or after the number, like ~ or ms. |
| Display Units | Auto shortens to K/M/B where space is tight. |
| Default Aggregation | What Golden does when you drop the field on a chart: Sum, Average and so on. |
Date cards work the same way, with a Date Format (like MM/DD/YYYY) and a Default Date Level (like Quarter). Geographic cards have a Location Type (Country, State, City, Postal Code), which is what lets a map place them.
Clean up a field from its card
Click ⋮ on any card for quick transforms on that field.
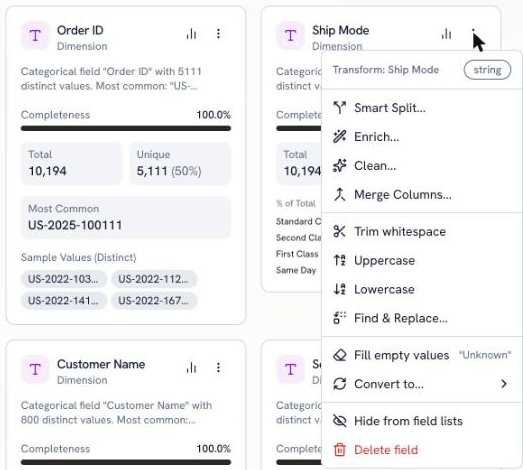
The menu holds Smart Split…, Enrich…, Clean…, Merge Columns…, Trim whitespace, Uppercase, Lowercase, Find & Replace…, Fill empty values, Convert to…, Hide from field lists and Delete field. Every change is a step in your prep, so Undo works.
List view
Switch to the list icon at the top right for a compact table: Name, Dashboard Label, Unique and Description for every field.
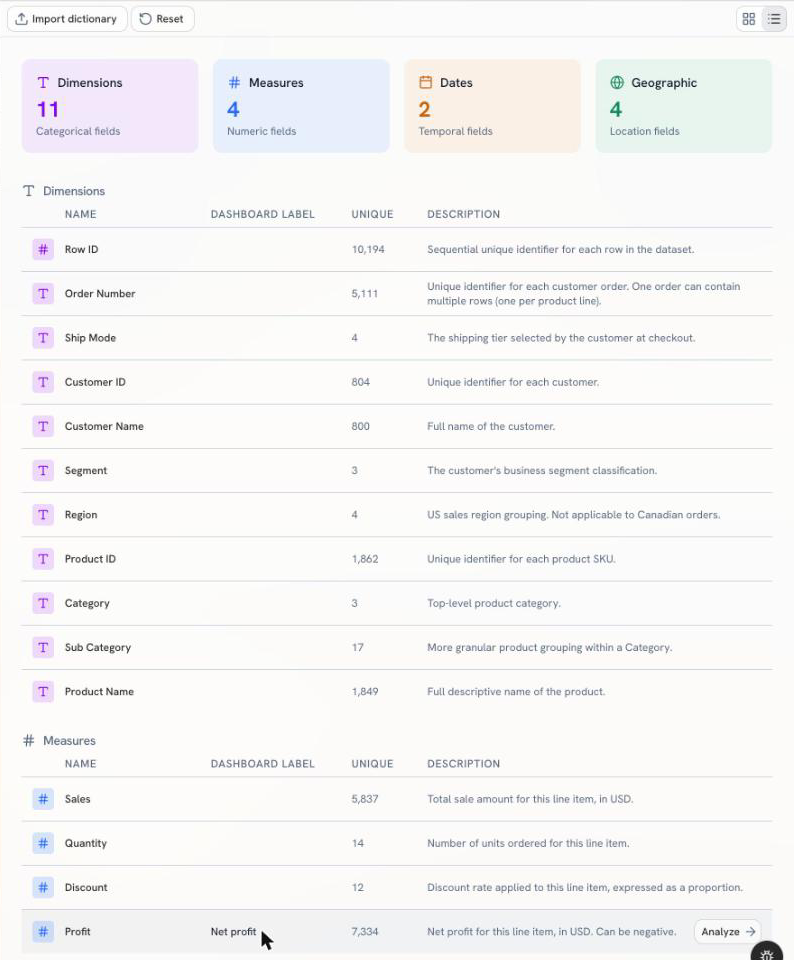
Click a Dashboard Label cell to give a field the name dashboards show (Profit shows as "Net profit") without renaming the field itself.
Import your own dictionary
Already have documentation? Click Import dictionary and give Golden one of three things.
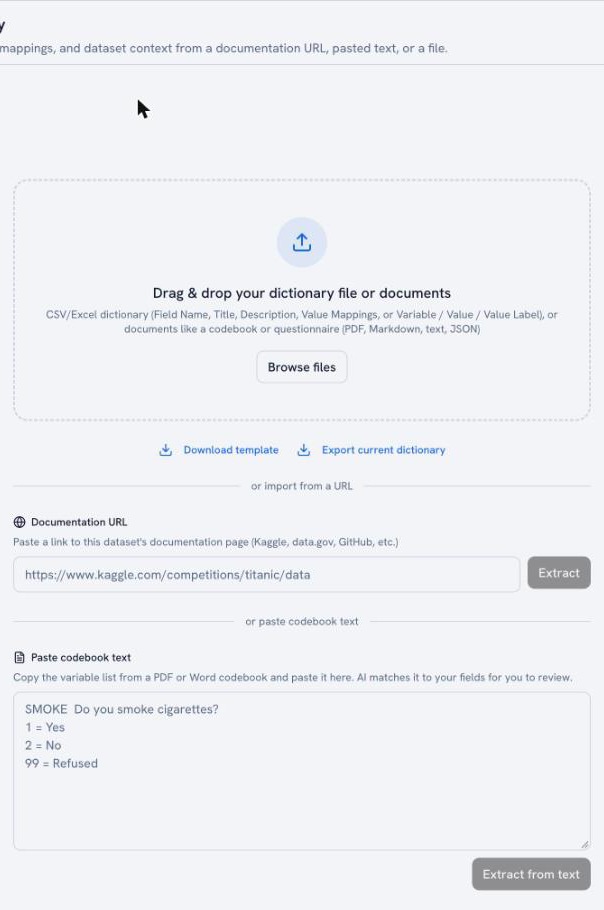
| Source | What to give it |
|---|---|
| A file | A CSV or Excel dictionary (Field Name, Title, Description, Value Mappings, or Variable / Value / Value Label), or documents like a codebook or questionnaire (PDF, Markdown, text, JSON). Drop several at once. |
| Documentation URL | A link to the dataset's documentation page (Kaggle, data.gov, GitHub and so on), then Extract. |
| Paste codebook text | Copy the variable list from a PDF or Word codebook and paste it, then Extract from text. |
Need a starting point? Download template gives you the CSV layout, and Export current dictionary saves what Golden already knows.
Upload a dictionary file
A dictionary file is one row per field, with these columns:
| Column | What goes in it |
|---|---|
| Field Name | The column name in your data, like Sub-Category. |
| Title | Optional. A friendlier name for the field, like Sub Category. |
| Description | What the field means, like "Net profit for this line item, in USD. Can be negative." |
| Value Mappings | Optional. Codes and their meanings, like Technology = Tech, Office Supplies = Office. |
Drop the file in and Golden matches every row to a field before it changes anything.
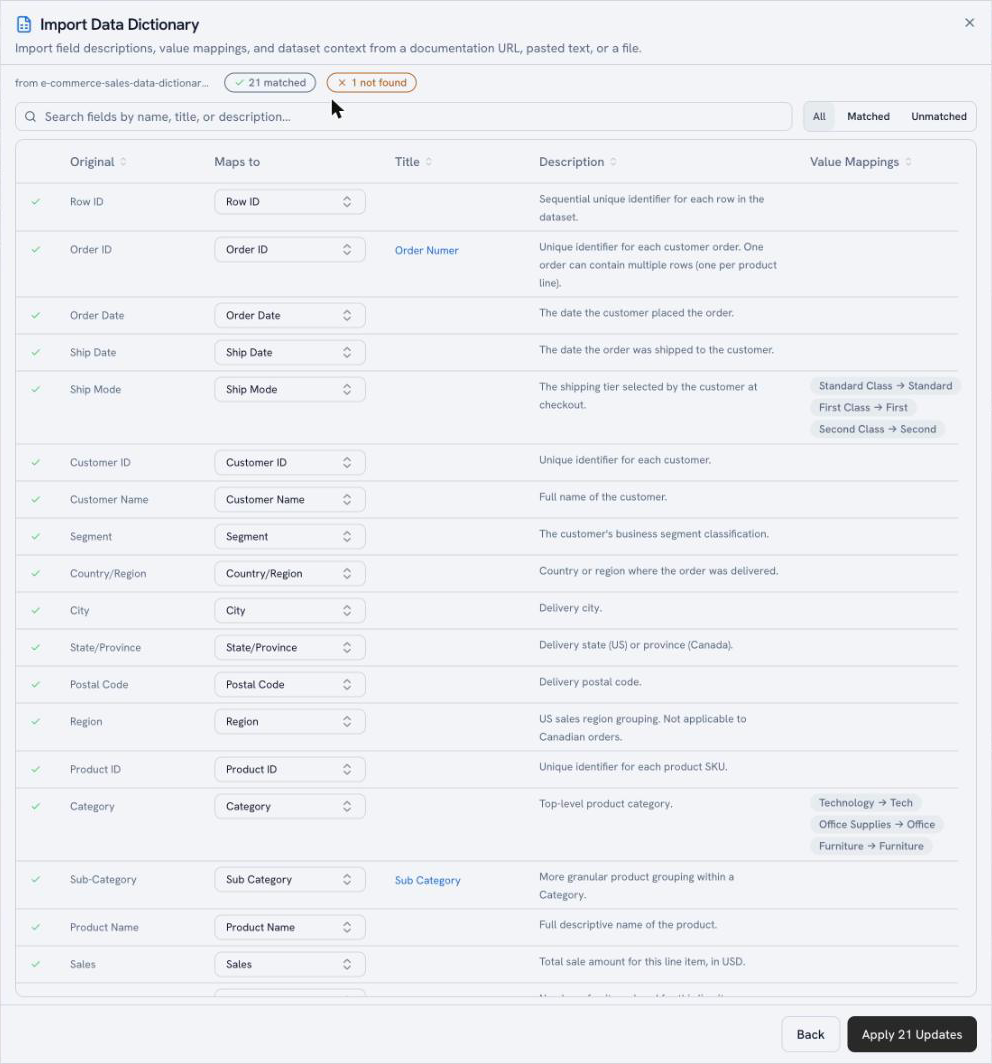
- Each row shows the Original name from your file and the field it Maps to. Golden matches close names too:
Sub-Categoryin the file lands on the Sub Category field. - Wrong match? Pick a different field from the Maps to dropdown.
- All, Matched and Unmatched filter the list, and the search box finds a field by name, title or description.
Anything that doesn't match a field shows as Not mapped and is skipped. Here, the file describes a Profit Margin field the dataset doesn't have.

Click Apply 21 Updates (the number matches your file) and the dictionary fills in.
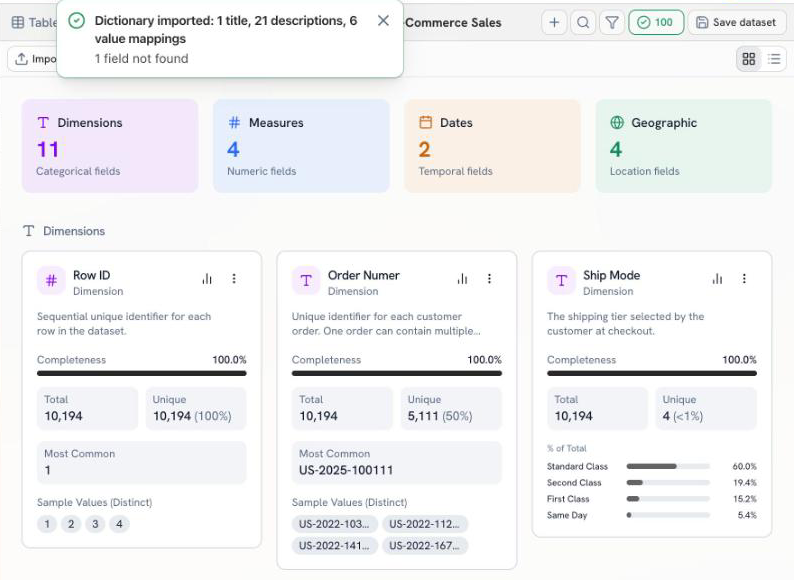
Value mappings are stored with the field so Golden's AI knows that "Tech" means Technology. Your data keeps its original values.
Import from a URL or pasted text
A URL or pasted codebook goes through Golden's AI, which reads the page or text and drafts the dictionary for you. The review adds three things:
- On Apply spells out exactly what happens: column renames, descriptions added, cell values changed.
- Dataset Summary and Coverage & Limitations give Golden's AI context about the whole dataset. Edit them freely.
- Replace coded values in data swaps codes like
D,S,Ffor their full names in your data. Leave it off and the codes are stored for the AI only, with no cell values changing.
Uncheck any field you don't want touched, then click Apply.
Start over
Reset at the top puts every field name back to its original and clears all descriptions. It asks first, because it can't be undone.
FAQ
Does the dictionary change my data? Descriptions, labels, formats and value mappings are metadata, so your values stay as they are. The two exceptions are titles, which rename fields, and Replace coded values in data when you turn it on.
Why does it matter for AI answers? Golden's AI reads your descriptions, value mappings and dataset summary when it explores your data and answers questions. A Profit field described as "Can be negative" doesn't get flagged as an error when it dips below zero.
Do format changes reach my dashboards? Yes. Number formats, display units, default aggregation and dashboard labels apply wherever the field is used.
My file's column names don't exactly match. Will it work? Usually. Golden matches close names (Sub-Category to Sub Category). For anything it misses, pick the field from Maps to in the review.
Can I import from a PDF? Yes. Drop the PDF in the import dialog, or paste the variable list from it into Paste codebook text.