Discover
AI-generated questions, insights, and chart suggestions for the dataset you just loaded.
Discover reads your dataset and hands you a starting point. It's for anyone who just connected data and wants to know what's in it, and what's worth a closer look, in the first minute.
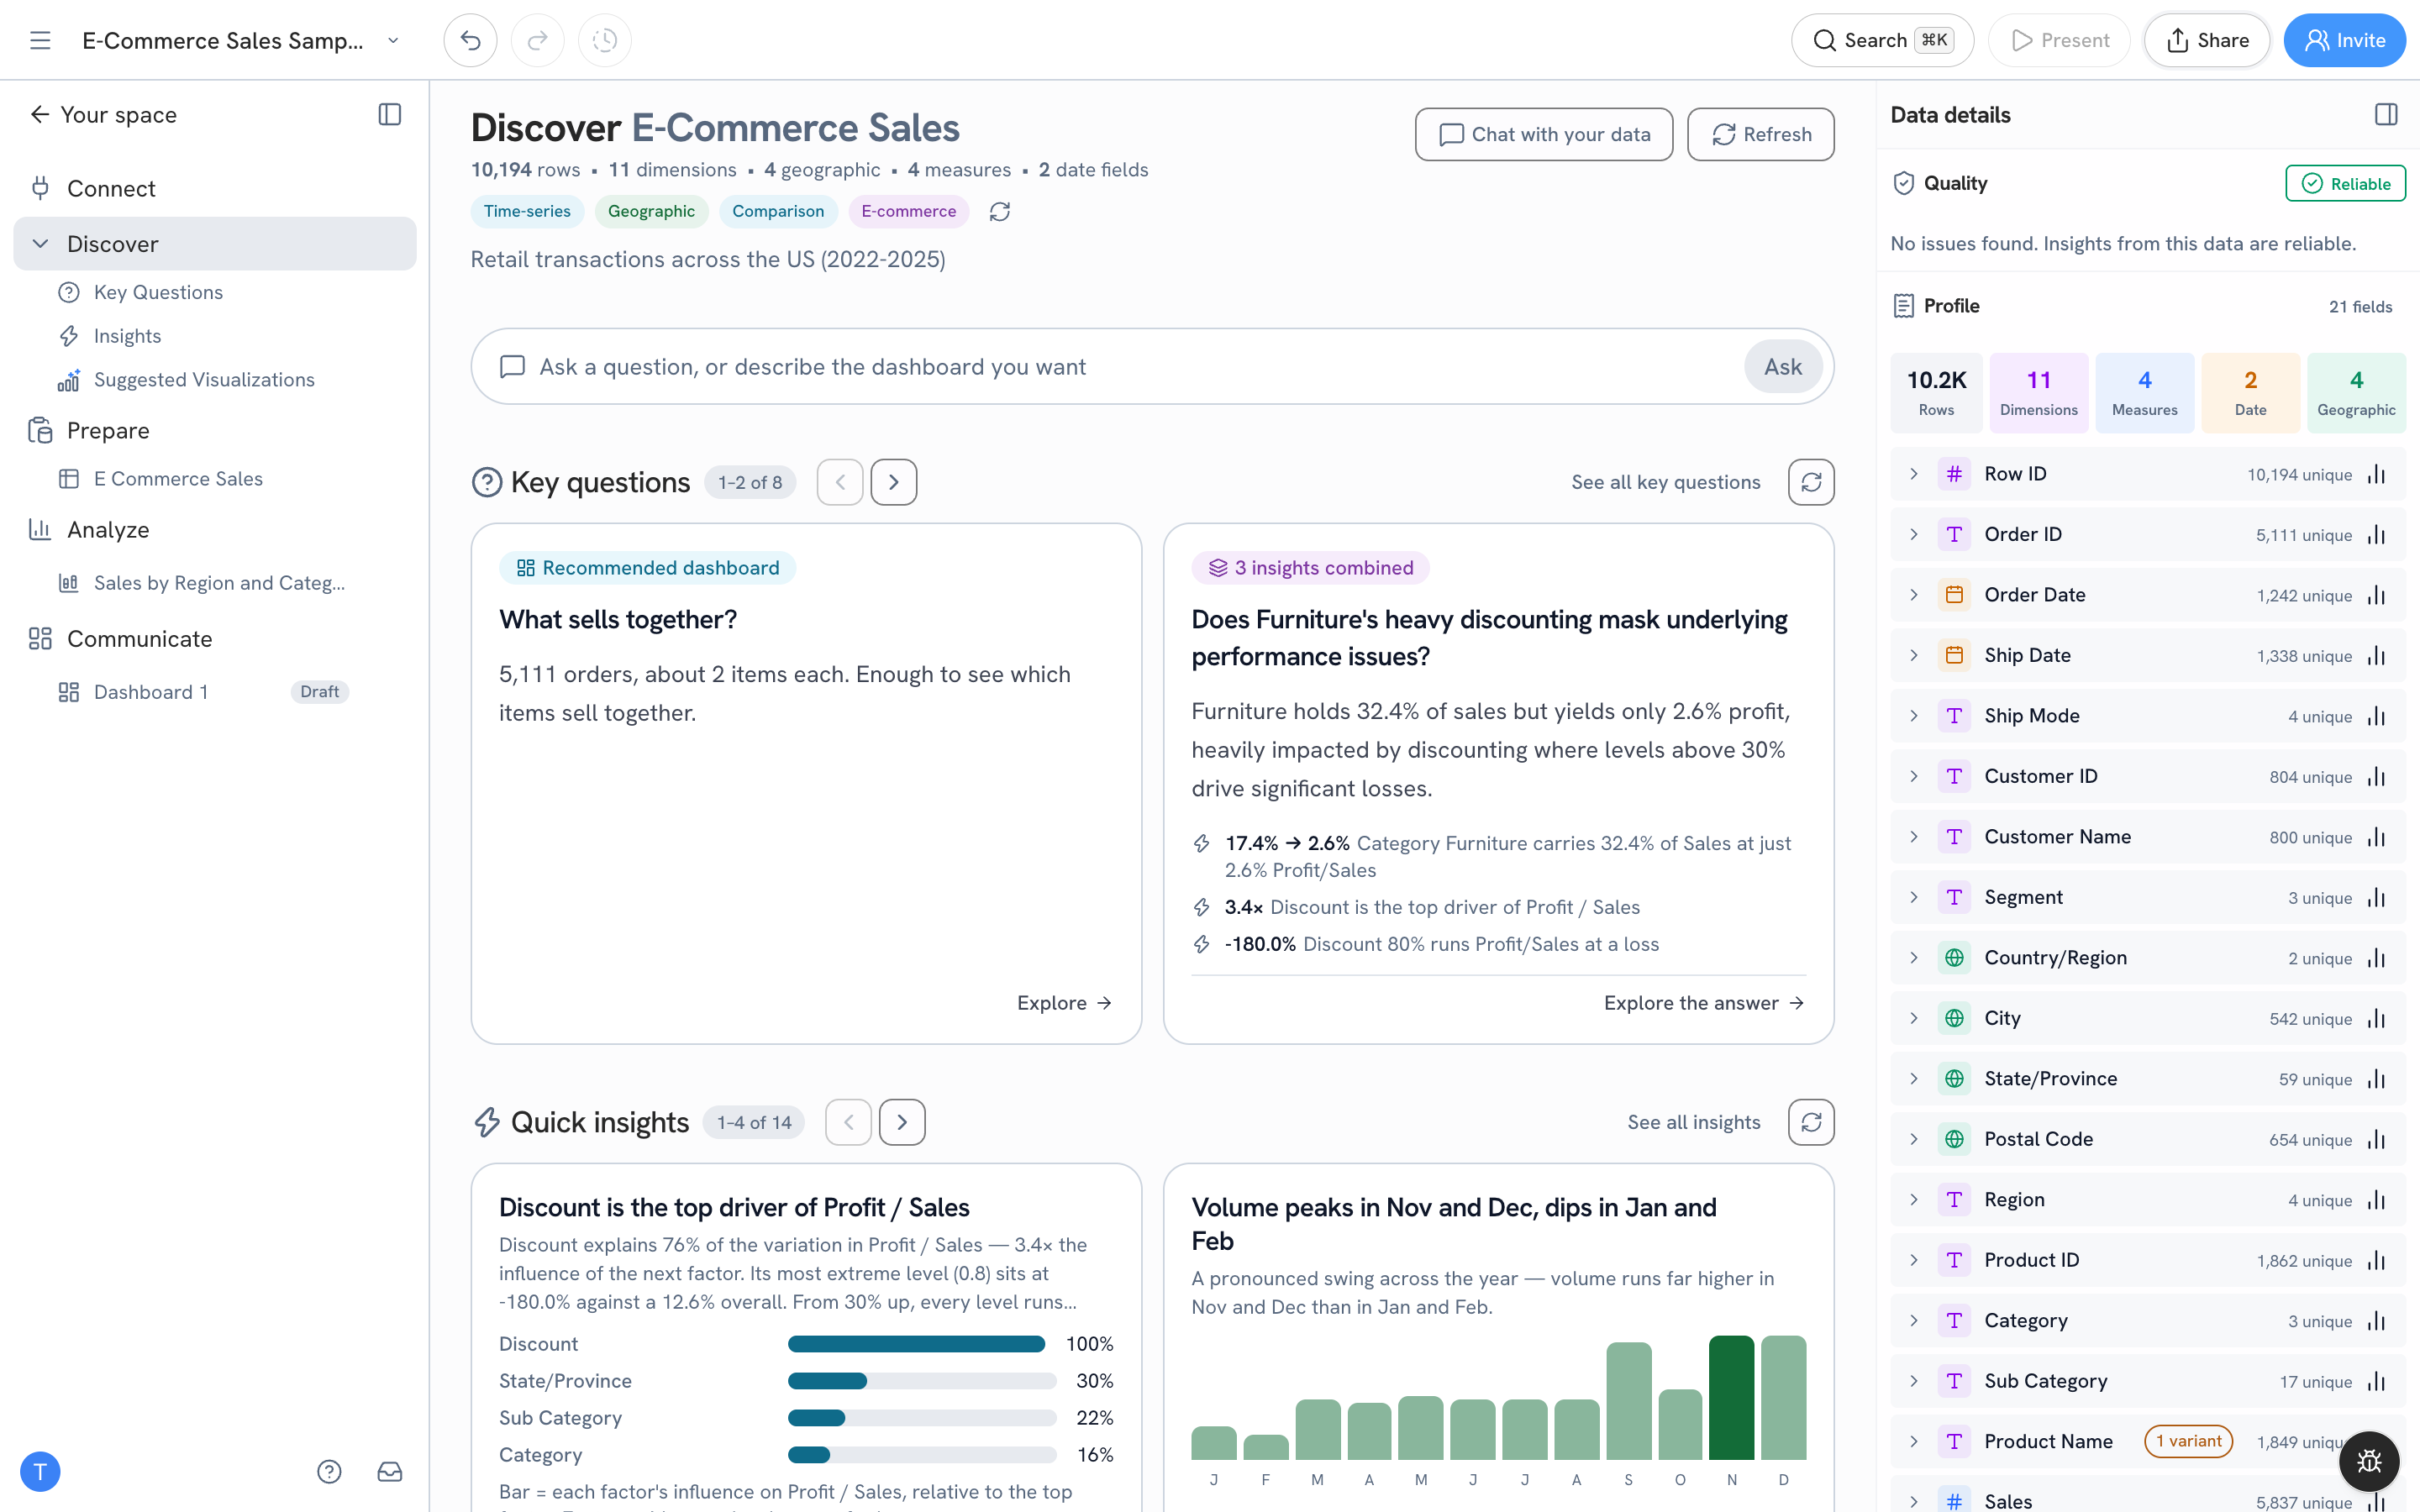
When to use it
- A new export lands on your desk. A sales ops analyst uploads 10,000 order rows. Discover tells them Discount is the top driver of Profit / Sales before they've opened a chart.
- Someone asks "anything interesting in here?" A team lead skims Quick insights, finds that Texas Binders lose 162.6% on Profit / Sales, and clicks Create dashboard on that card.
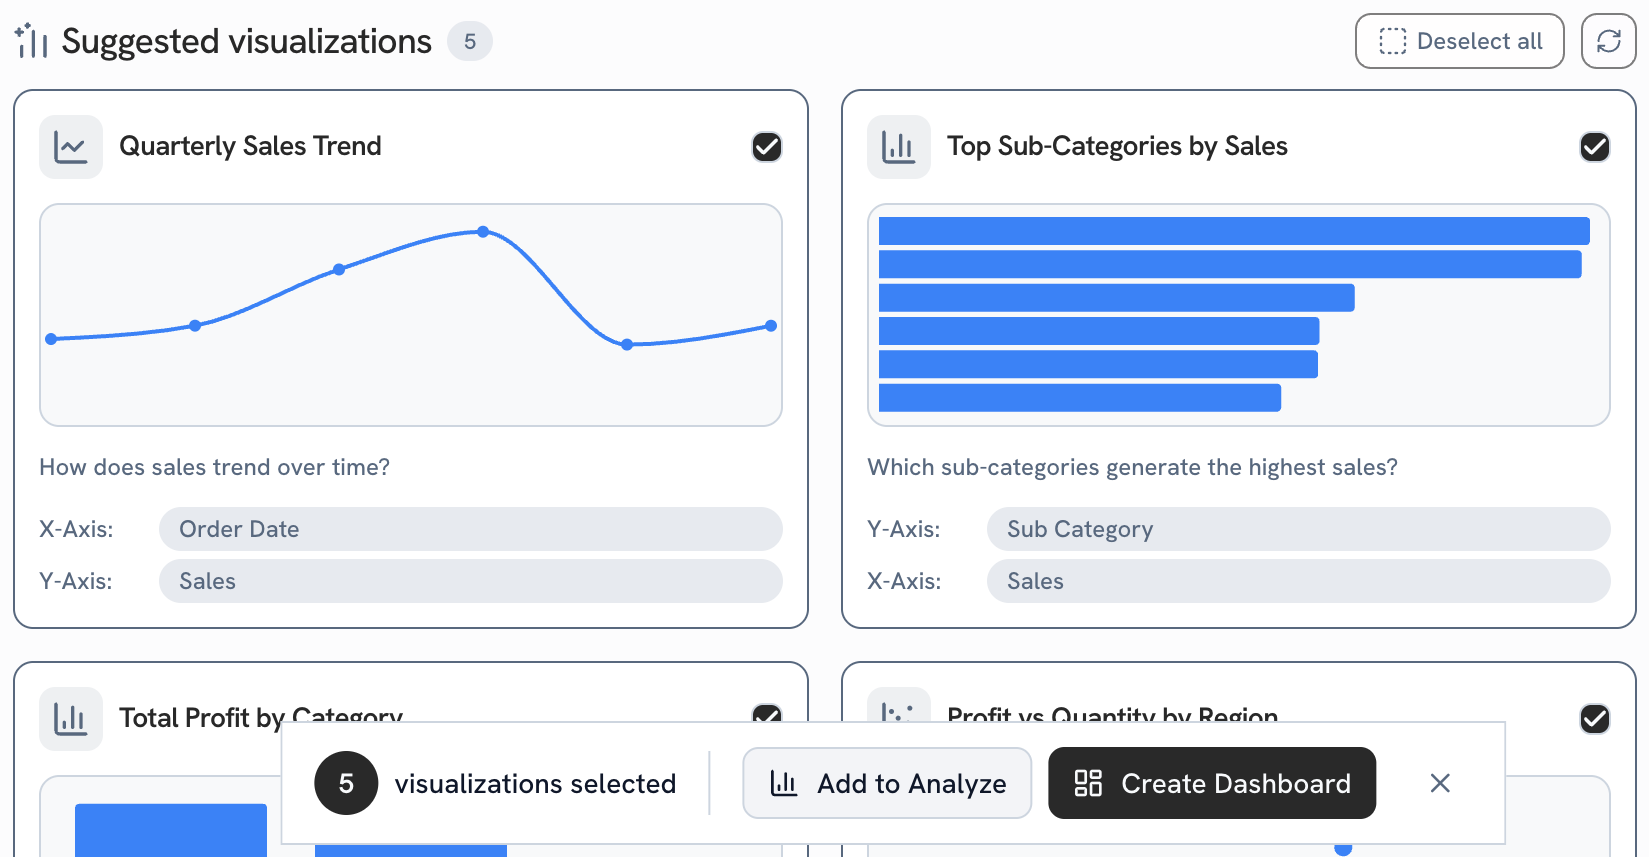
- You need a first dashboard fast. A marketing manager ticks five Suggested visualizations and clicks Create Dashboard.
- You don't trust the file yet. The Quality check says whether insights from this data are reliable, and the Profile shows every field's unique values and range.
If you're staring at a fresh dataset and wondering where to start, start here.
Getting started
- Connect or upload data (or pick a sample from Home).
- Open the analysis and click Discover in the left rail.
- Read the summary, then scroll: Key questions, Quick insights, Suggested visualizations.
The left rail also links straight to Key Questions, Insights and Suggested Visualizations, each as a full page.
The header
The top of the page names the dataset and counts its rows, dimensions, geographic fields, measures and date fields. Tags like Time-series, Geographic and E-commerce say what kind of data Golden thinks it is, with a one-line description underneath.
- Chat with your data opens the chat panel.
- Refresh reruns the analysis, for example after you change the data in Prepare.
- The Ask box takes a question, or a description of the dashboard you want.
Key questions
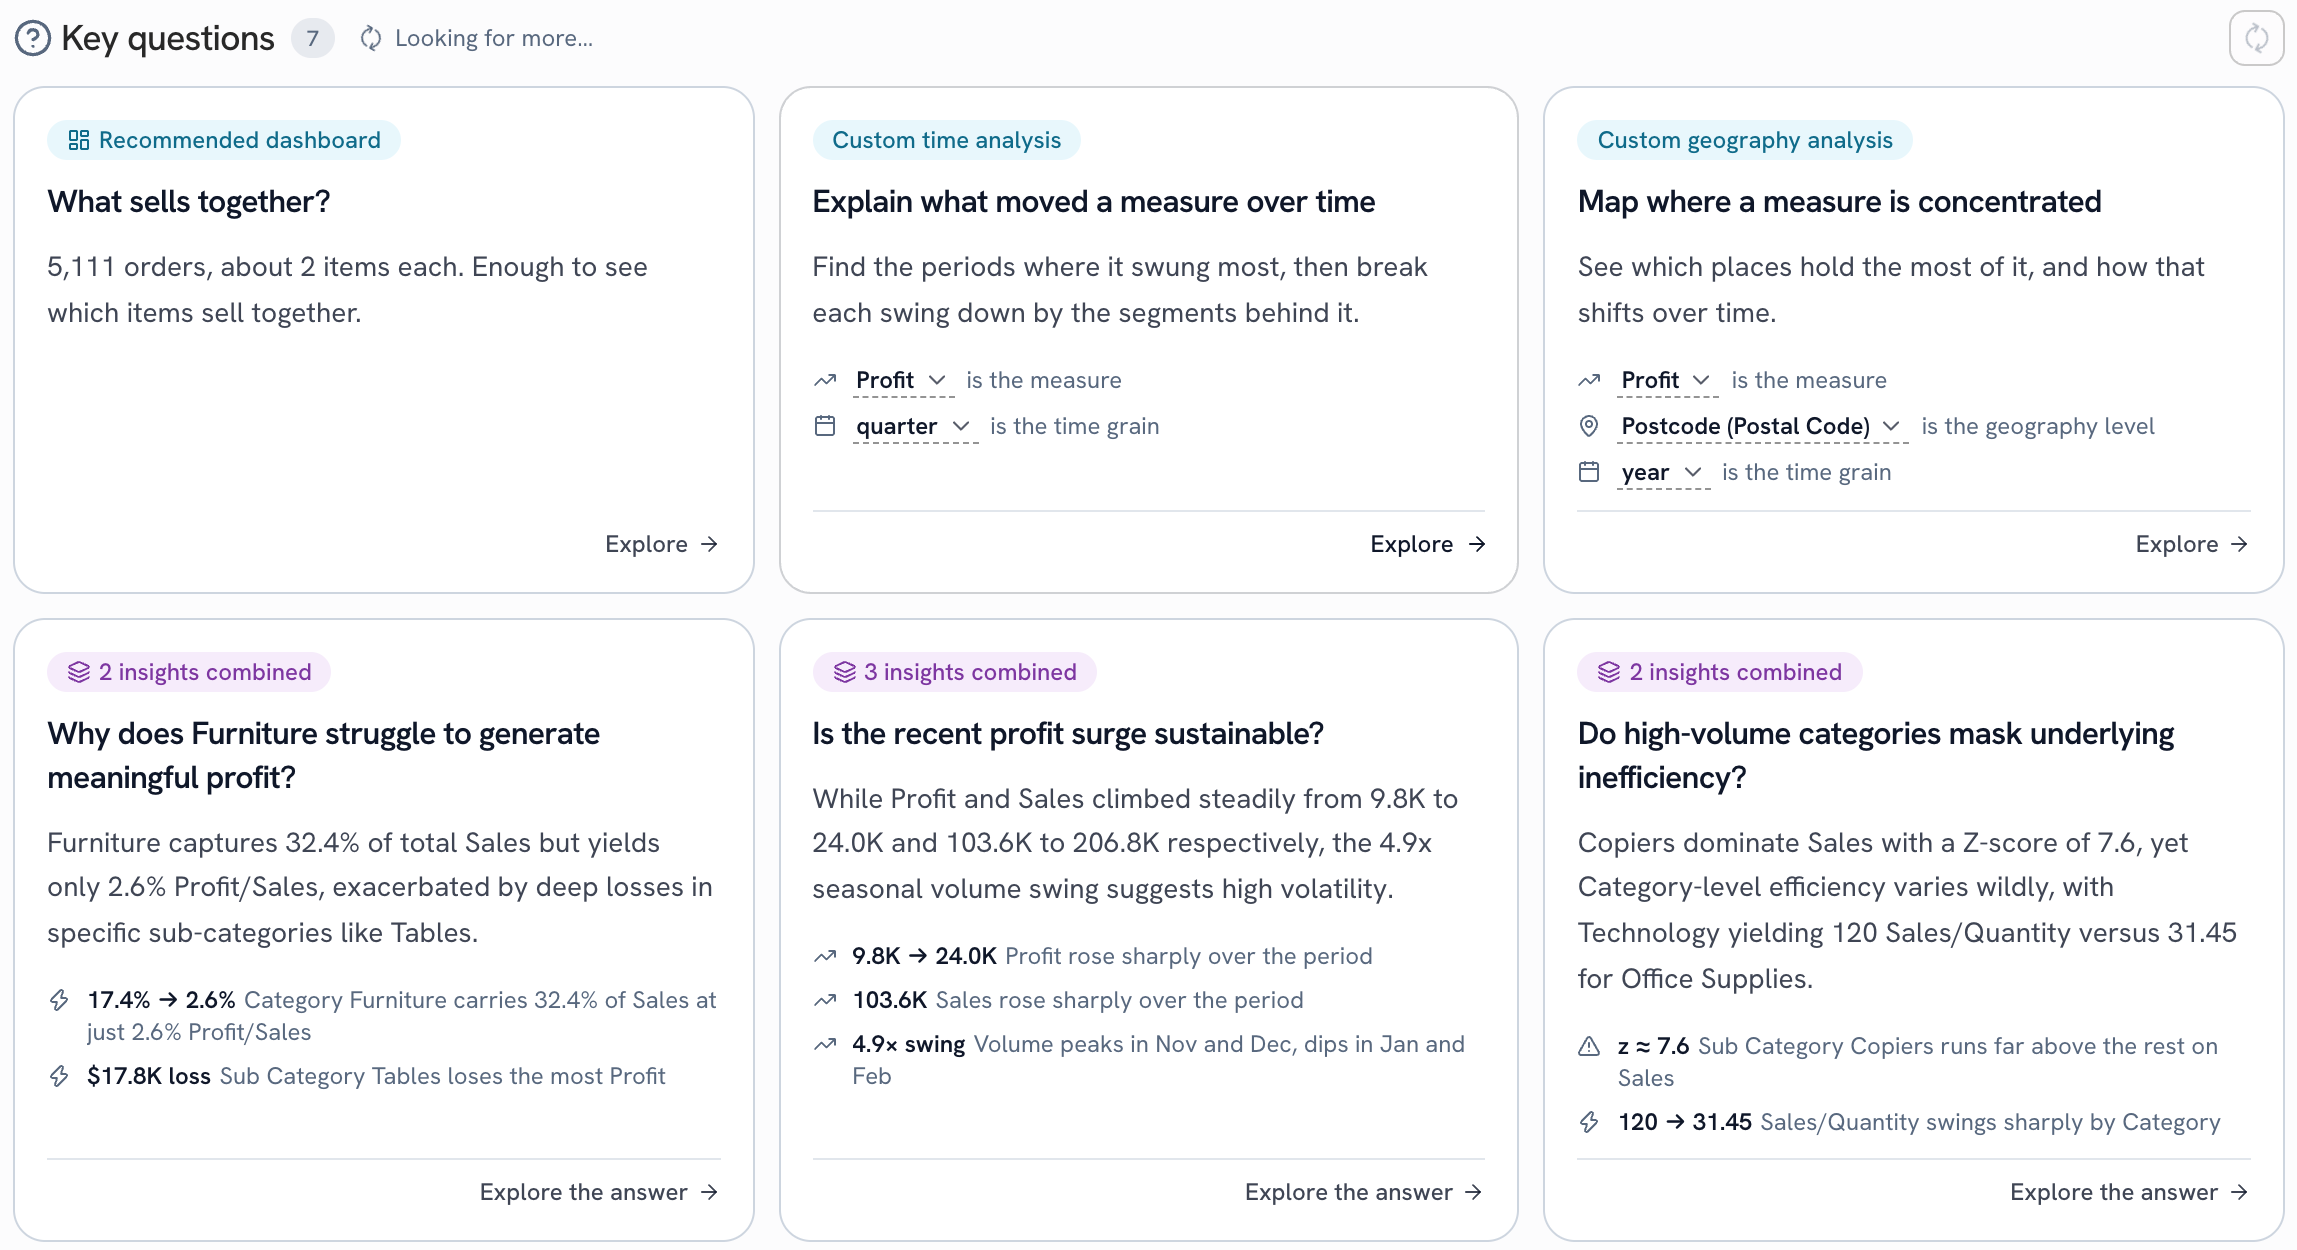
Key questions are the questions your data can answer well. Each card tells you what kind it is:
| Card | What it does |
|---|---|
| Recommended dashboard | A ready analysis Golden can build for this data, like "What sells together?" for order data. |
| Custom time analysis | Finds the periods where a measure swung most and breaks each swing down. Pick the measure and the time grain. |
| Custom geography analysis | Shows where a measure is concentrated and how that shifts. Pick the measure, geography level and time grain. |
| _N_ insights combined | A question built from several insights, with the supporting numbers listed under it. |
Click Explore or Explore the answer to open the answer. Use the arrows to page through, or See all key questions for the full grid.
Quick insights
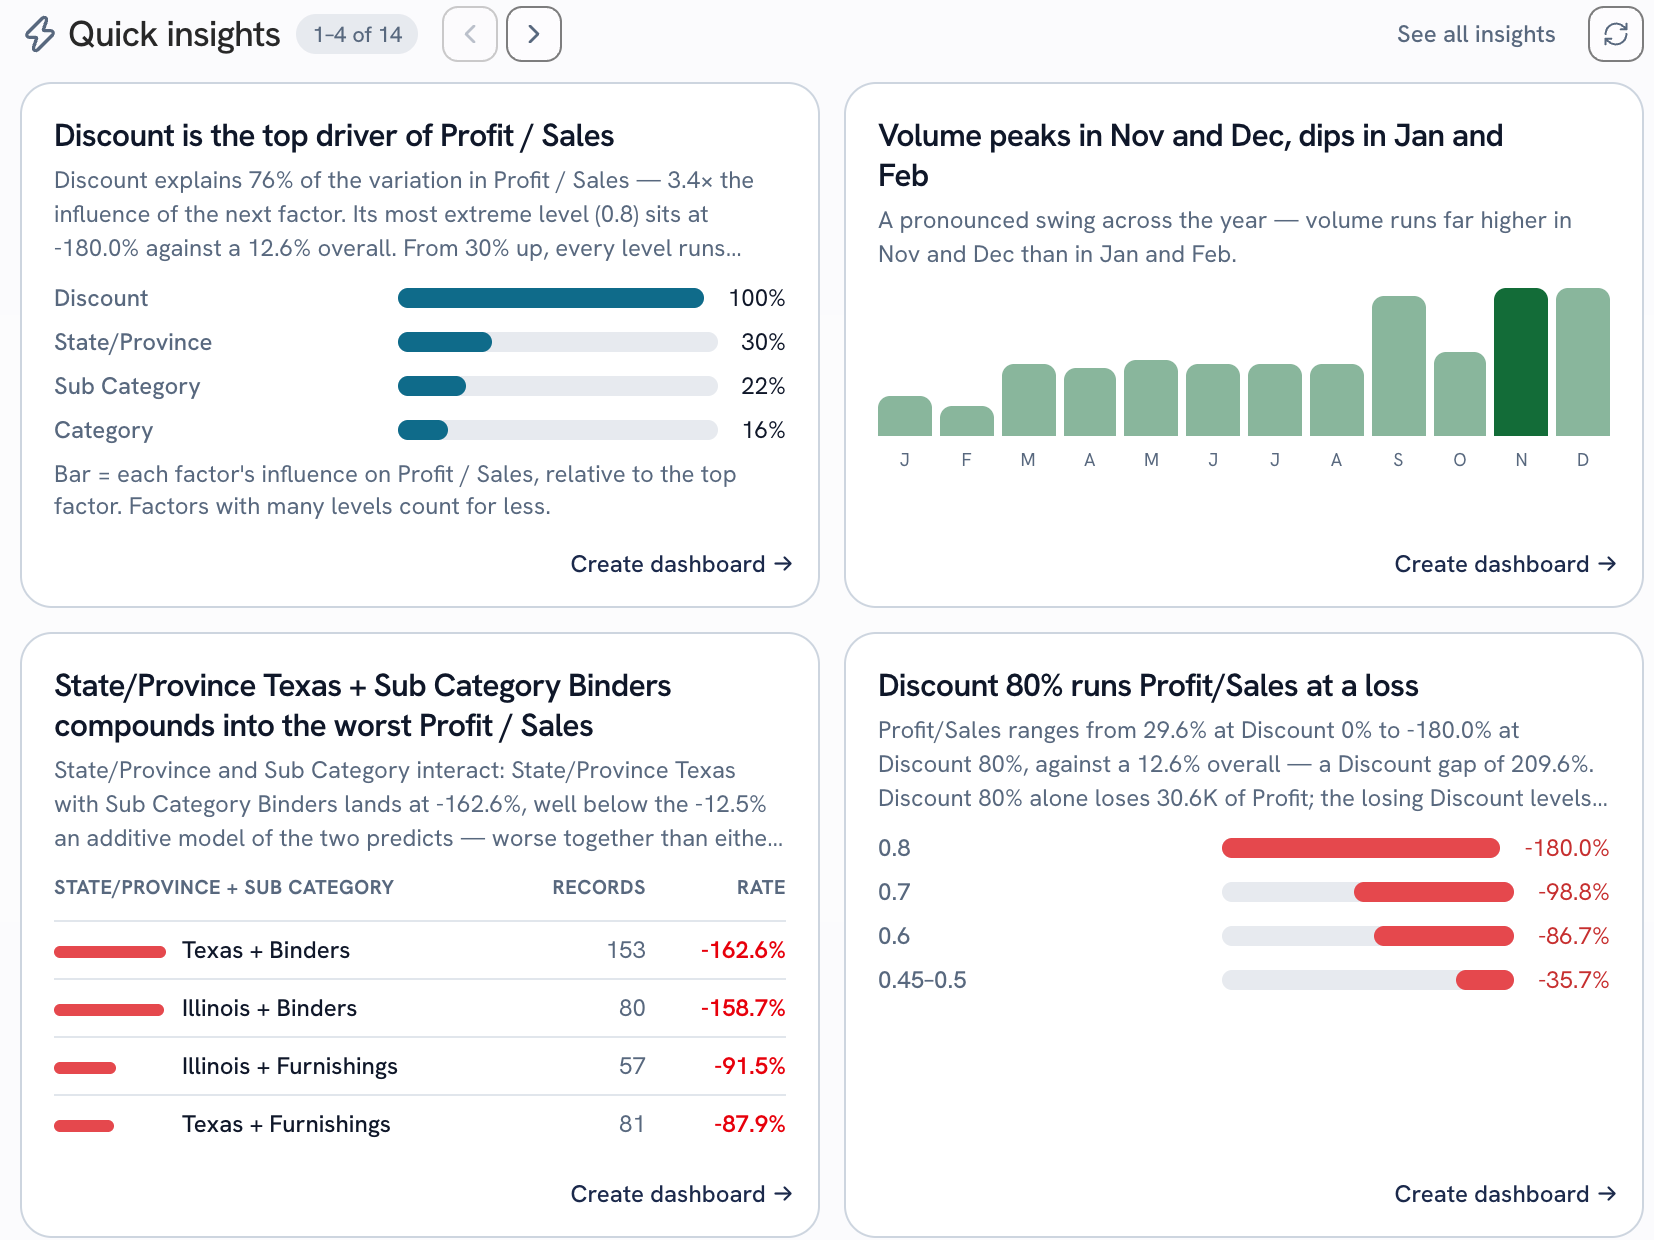
Quick insights are patterns Golden found on its own: the top driver of a measure, a seasonal swing, a combination that's worse together than apart, a level that runs at a loss. Each card says what it found in plain numbers and shows a small chart or table to back it up.
Click Create dashboard on a card to turn that insight into a dashboard. See all insights opens the full list.
Suggested visualizations
Golden suggests a handful of charts for your data, each with the question it answers and the fields it puts on each axis.
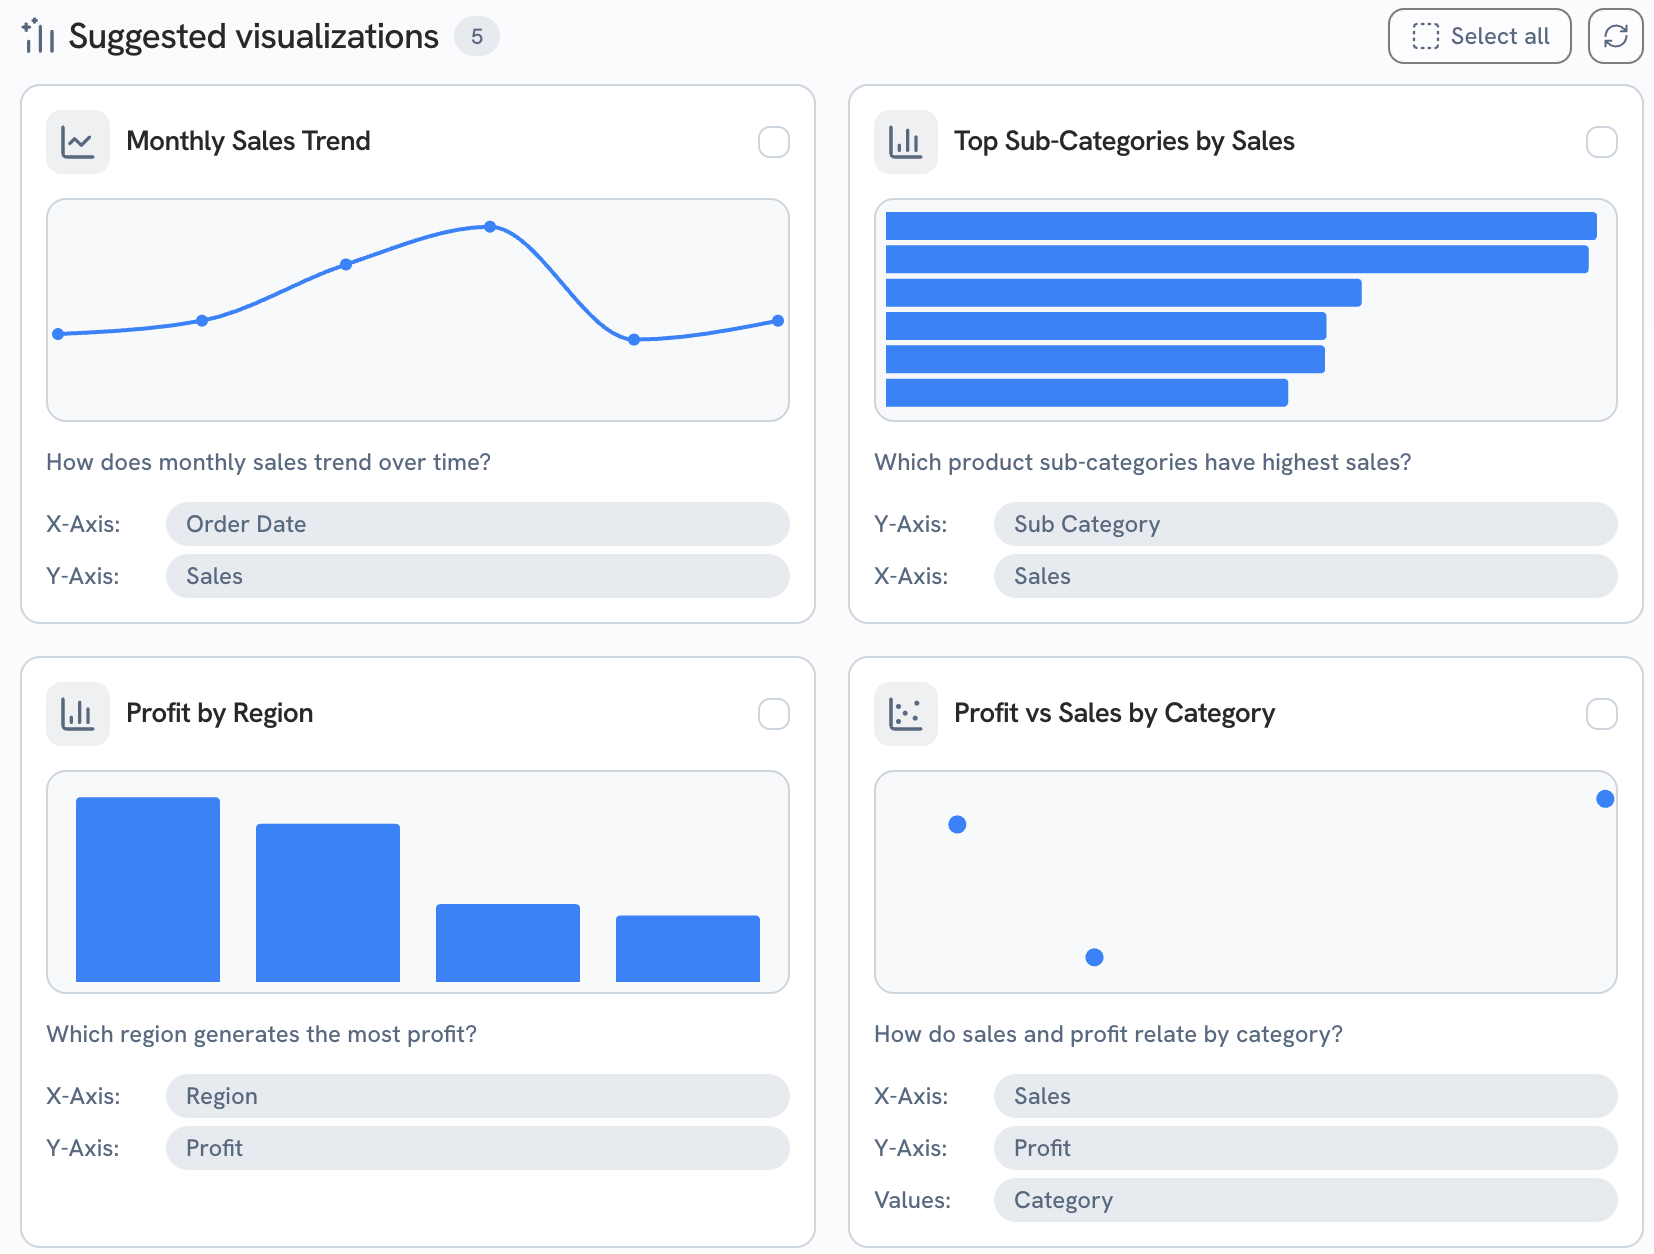
Tick the checkbox on the charts you want, or click Select all. A bar appears at the bottom:
- Add to Analyze adds each one as a sheet you can keep editing.
- Create Dashboard puts them all on a new dashboard.
Data details
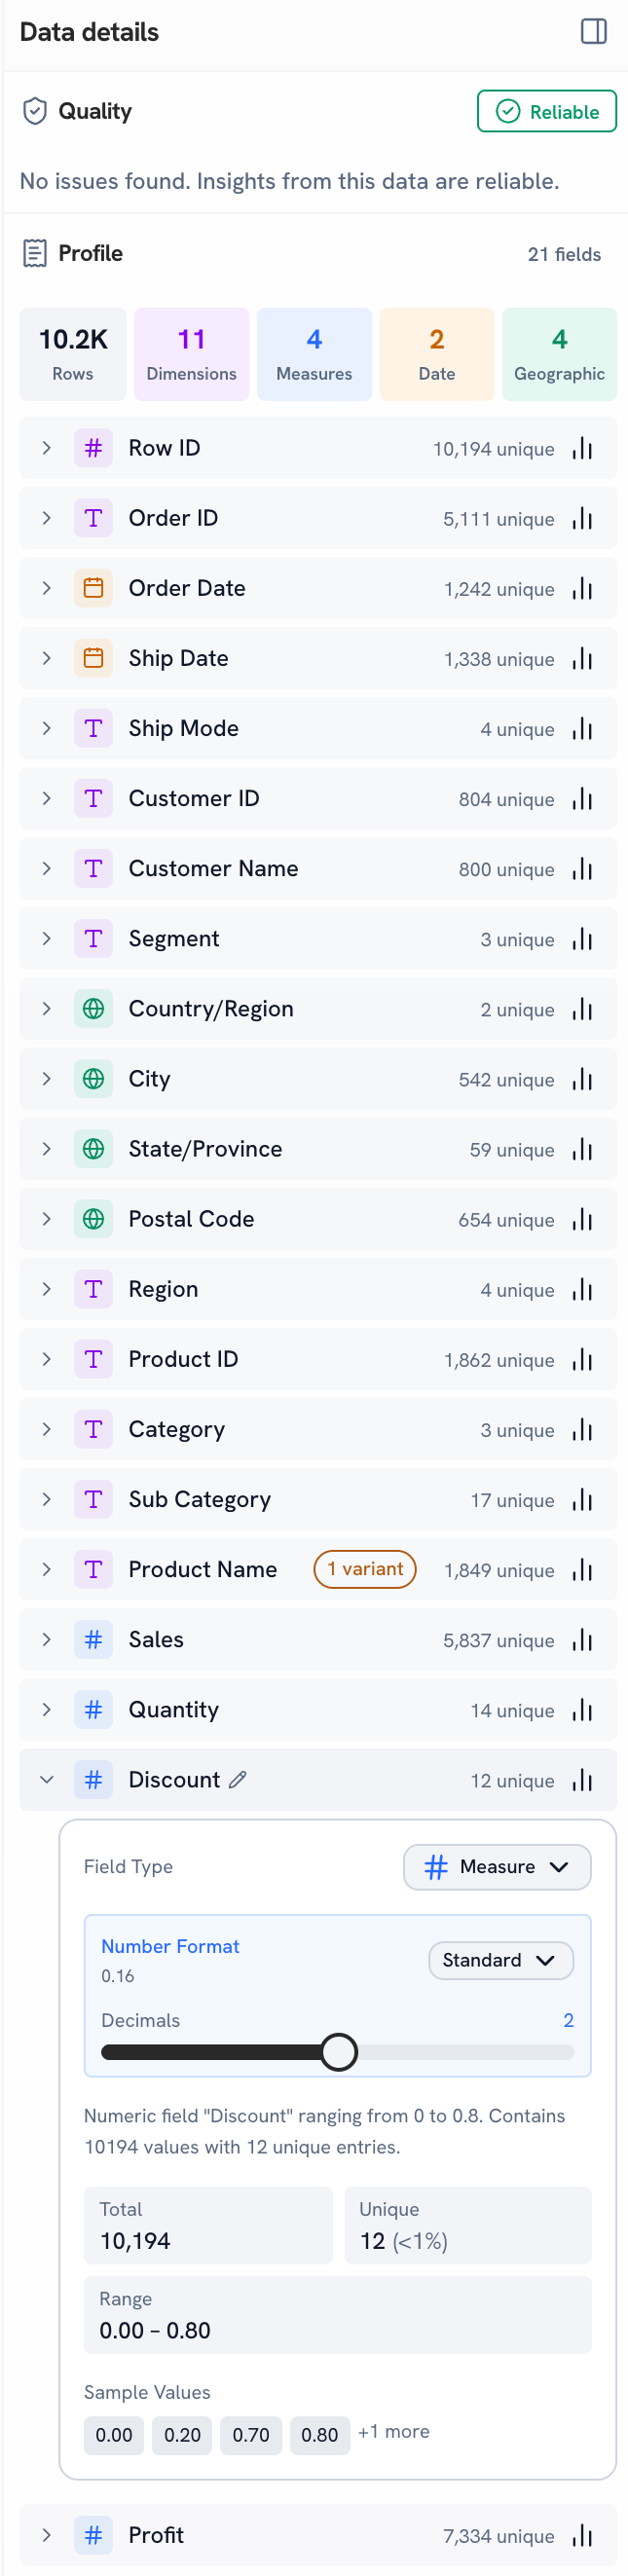
The Data details panel on the right is your sanity check.
- Quality gives a verdict. Reliable means no issues were found and insights from this data are reliable.
- Profile counts rows, dimensions, measures, dates and geographic fields, then lists every field with its unique count.
Click a field to expand it. You'll see its Field Type, number format, a short description, Total, Unique, Range and sample values. Click the chart icon on a field to analyze it in a new sheet. Collapse the panel with the icon at its top right.
Do it from chat
The Ask box at the top of Discover goes to the same analyst as chat. Ask a question, or describe the dashboard you want:
Which regions lose money on discounted orders?Build a dashboard of monthly sales and profit by categoryFAQ
Does Discover change my data? No. It only reads it. Changes happen in Prepare.
Why did my key questions change? Golden keeps looking while you're on the page ("Looking for more…"), and Refresh reruns the analysis. Questions and suggestions can differ between runs.
Can I edit a suggested chart before using it? Add it with Add to Analyze, then change anything on the sheet.
What if Quality isn't Reliable? The panel lists what it found. Fix those fields in Prepare, then click Refresh.